Author Affiliations
School of Electrical and Automation Engineering, East China Jiaotong University, Nanchang, Jiangxi 330013, Chinashow less
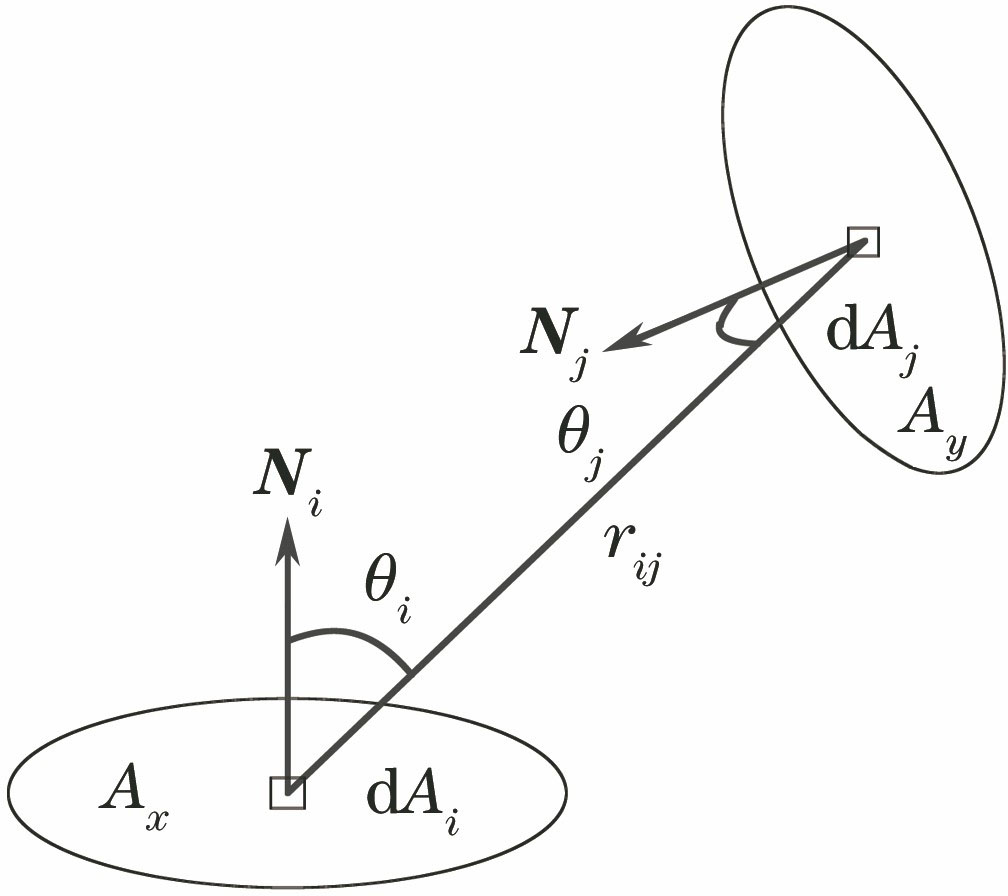
Fig. 1. Calculation of reflection factorbetween two points
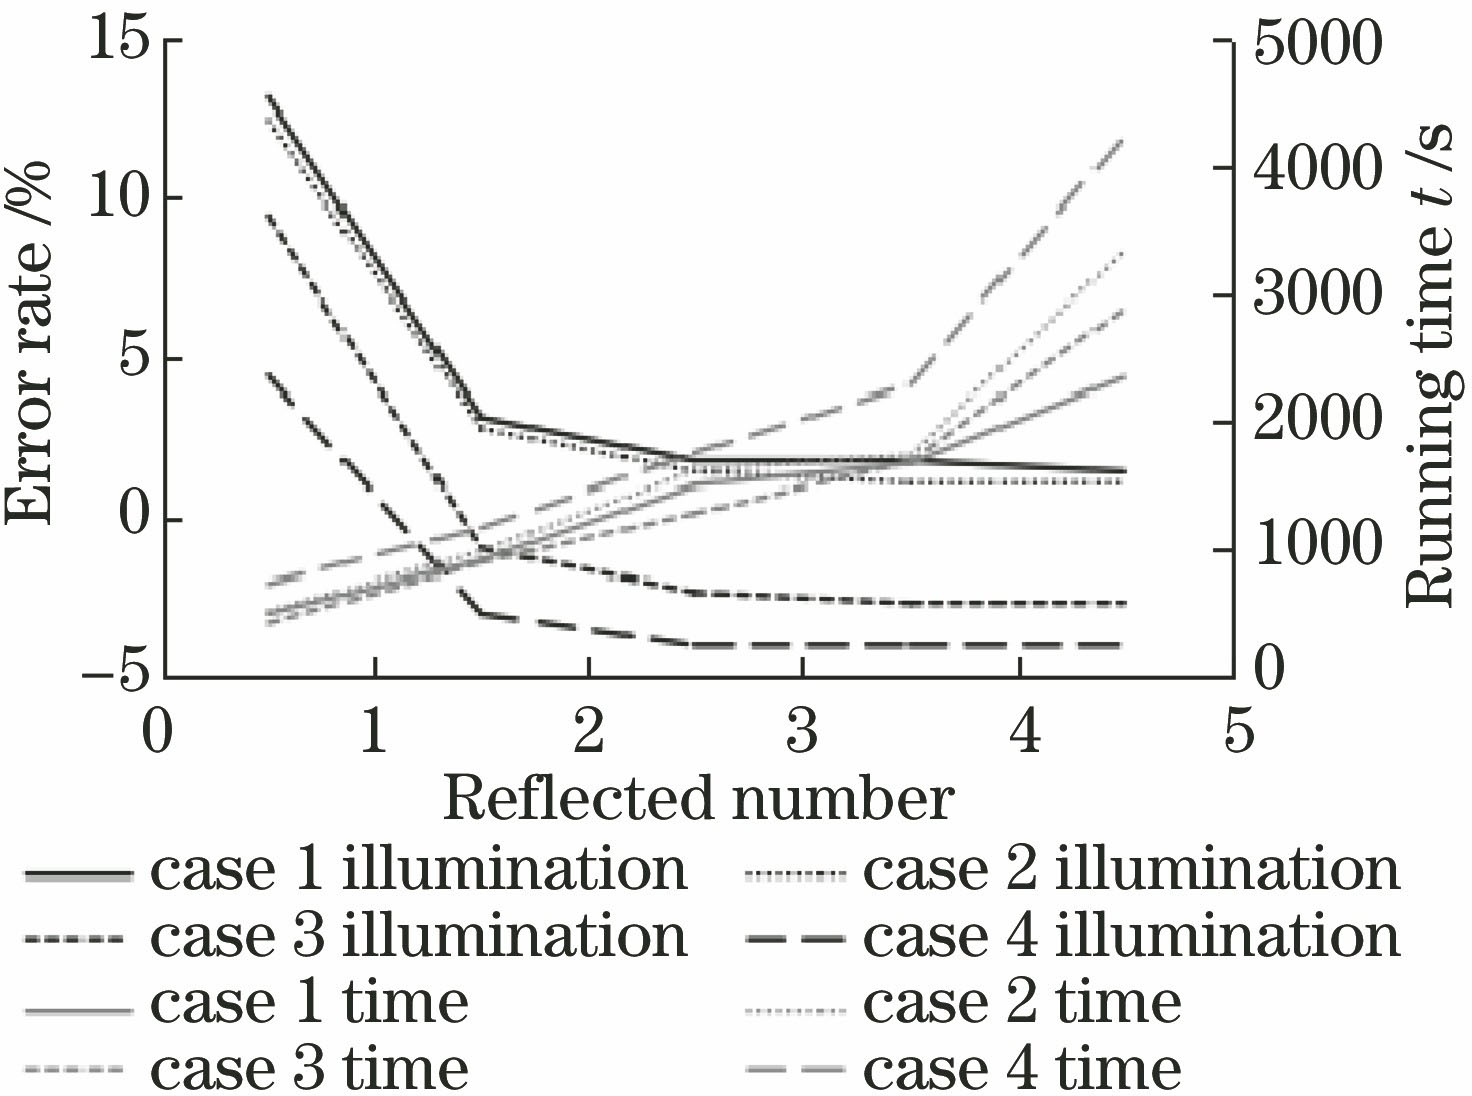
Fig. 2. Average illuminance error rate and running time versus number of reflection calculations
Fig. 3. Illuminance distribution results of work surface for each case. (a) Case 1, model simulation; (b) Case 2, model simulation; (3) Case 3, model simulation; (d) Case 4, model simulation; (e) Case 1, DIALux simulation; (f) Case 2, DIALux simulation (g) Case 3, DIALux simulation; (h) Case 4, DIALux simulation
Fig. 4. Illumination error rates of each case
Fig. 5. Definition of diffuse reflection parameters
Fig. 6. Error rate of each illuminance value as a function of roughness
Number | Space bottom shape | Lighting arrangement |
---|
Case 1 | Conventionalrectangular space | Uniformarrangement | Case 2 | Unequal space onthe ground | Uniform arrangement | Case 3 | Conventionalrectangular space | Unequal heights | Case 4 | Round floor space | Ring arrangement |
|
Table 1. Cases of light environment model
Case type | Averagedirectillumination /lx | Averagereflectedilluminance /lx | Averageillumination /lx |
---|
Case 1 /lx | 208 | 77 | 284 | DIALux /lx | 206 | 82 | 289 | Error rate /% | -0.76 | -6.48 | 0.76 | Case 2 /lx | 208 | 77 | 285 | DIALux /lx | 206 | 82 | 288 | Error rate /% | 0.77 | -5.74 | -1.08 | Case 3 /lx | 220 | 83 | 303 | DIALux /lx | 216 | 80 | 296 | Error rate /% | 2.05 | 3.76 | 2.52 | Case 4 /lx | 202 | 92 | 293 | DIALux /lx | 205 | 90 | 295 | Error rate /% | -1.63 | 1.78 | -0.60 |
|
Table 2. Comparison of average illuminance calculation results
Case type | Minimumillumination /lx | Maximumillumination /lx | Illuminationuniformity |
---|
Case 1 /lx | 119 | 348 | 0.34 | DIALux /lx | 176 | 350 | 0.50 | Error rate /% | 33.9 | 0.6 | 32 | Case 2 /lx | 119 | 349 | 0.34 | DIALux /lx | 175 | 350 | 0.50 | Error rate /% | 34.1 | 0.3 | 32 | Case 3 /lx | 170 | 381 | 0.33 | DIALux /lx | 173 | 368 | 0.47 | Error rate /% | 26.6 | 3.5 | 29.8 | Case 4 /lx | 184 | 344 | 0.54 | DIALux /lx | 221 | 329 | 0.67 | Error rate /% | 16.7 | -4.6 | 19.4 |
|
Table 3. Comparison of illuminance uniformity calculation results
Case type | Edmax | Edmin | Efmax | Efmin |
---|
Case 1 /lx | 274 | 101 | 95 | 18 | DIALux /lx | 274 | 100 | 103 | 75 | Error rate /% | 0 | 0.50 | -7.38 | -75.6 | Case 2 /lx | 274 | 101 | 92 | 18 | DIALux /lx | 274 | 100 | 101 | 75 | Error rate /% | 0 | 0.50 | -8.81 | -75.8 | Case 3 /lx | 297 | 103 | 103 | 19 | DIALux /lx | 295 | 98 | 103 | 71 | Error rate /% | 0.68 | 5.10 | 0.00 | -73.2 | Case 4 /lx | 246 | 140 | 138 | 44 | DIALux /lx | 242 | 141 | 114 | 75 | Error rate /% | 1.65 | -0.71 | 21.05 | -41.3 |
|
Table 4. Comparison of direct and reflected components of light energy
Case type | Edv | Efv | Ev | Emax | Emin | U |
---|
Case 1 /lx | 208 | 79 | 283 | 348 | 160 | 0.46 | DIALux /lx | 206 | 82 | 289 | 350 | 176 | 0.50 | Error rate /% | -0.76 | -3.66 | 0.31 | 0.6 | 9.10 | 8.05 | Case 2 /lx | 208 | 78 | 286 | 349 | 167 | 0.48 | DIALux /lx | 206 | 82 | 288 | 350 | 175 | 0.50 | Error rate /% | 0.77 | -4.89 | -1.08 | 0.3 | 4.57 | 4.30 | Case 3 /lx | 220 | 82 | 302 | 381 | 169 | 0.44 | DIALux /lx | 216 | 80 | 296 | 368 | 173 | 0.47 | Error rate /% | 2.05 | 2.56 | 2.02 | 3.5 | 2.31 | 2.64 | Case 4 /lx | 202 | 92 | 291 | 344 | 219 | 0.64 | DIALux /lx | 205 | 90 | 295 | 329 | 221 | 0.67 | Error rate /% | -1.63 | 1.78 | -1.36 | -4.6 | 0.90 | 4.98 |
|
Table 5. Simulated illuminance value and uniformity error after model improvement