
Li-sheng ZHANG. Photocatalytic Properties Based on Graphene Substrate[J]. Spectroscopy and Spectral Analysis, 2022, 42(4): 1058
- Spectroscopy and Spectral Analysis
- Vol. 42, Issue 4, 1058 (2022)
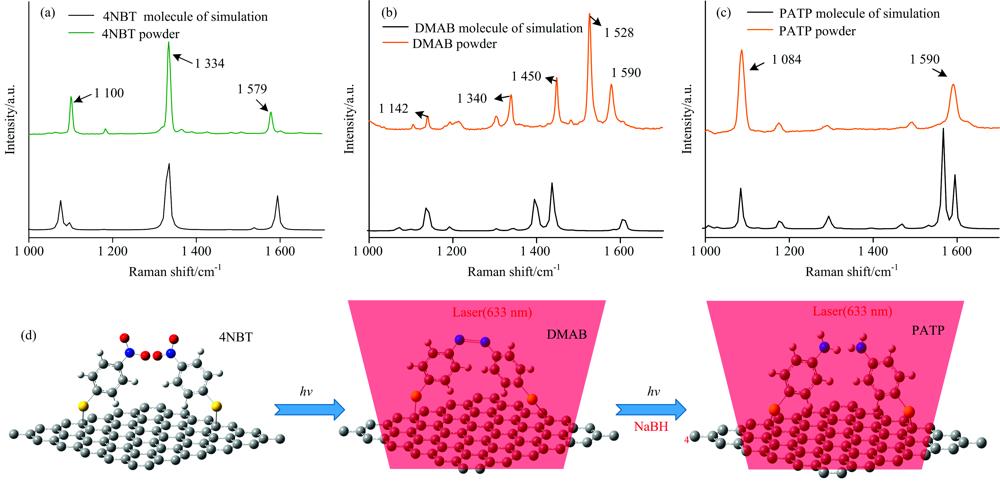
Fig. 1. Photocatalytic process based on graphene substrate
(a): Raman spectra of 4NBT molecule; (b): Raman spectra of DMAB molecule; (c) Raman spectra of PATP molecule; (d): Schematic diagram of plasma driven photocatalytic reaction
(a): Raman spectra of 4NBT molecule; (b): Raman spectra of DMAB molecule; (c) Raman spectra of PATP molecule; (d): Schematic diagram of plasma driven photocatalytic reaction
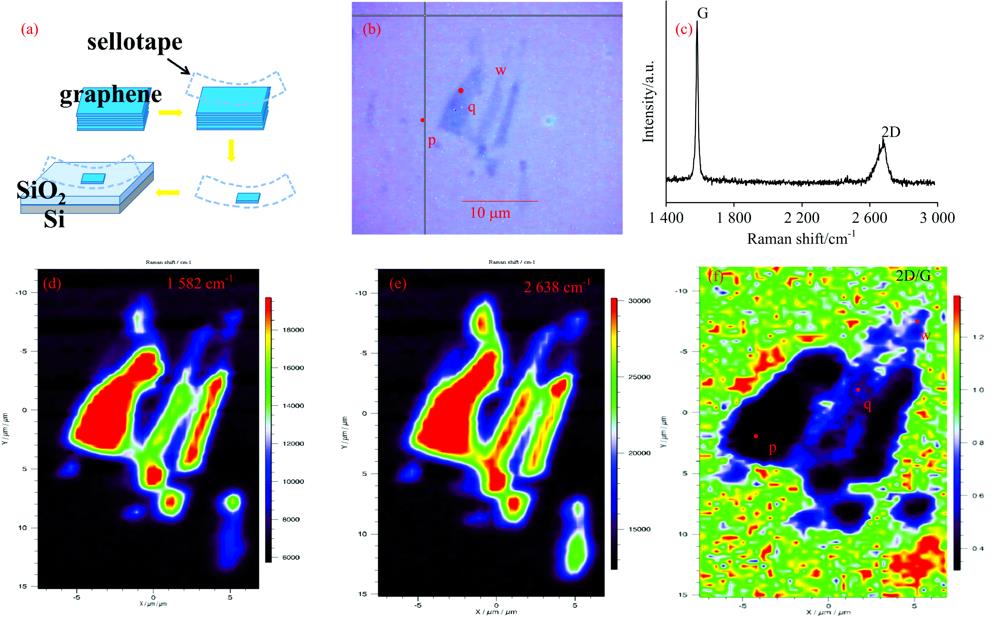
Fig. 2. Preparation and characterization of graphene samples
(a): Schematic diagram of graphene sample preparation process; (b): Optical microscope images of graphene samples; (c): Raman spectra of graphene samples; (d): Raman mapping image of the intensity of peak at 1 582 cm-1;(e): Raman mapping image of the intensity of peak at 2 638 cm-1;(f): Raman mapping image of the intensity ratio of 2D/G
(a): Schematic diagram of graphene sample preparation process; (b): Optical microscope images of graphene samples; (c): Raman spectra of graphene samples; (d): Raman mapping image of the intensity of peak at 1 582 cm-1;(e): Raman mapping image of the intensity of peak at 2 638 cm-1;(f): Raman mapping image of the intensity ratio of 2D/G
Fig. 3. SERS and photocatalytic properties of graphene substrate
(a): Optical microscope image of graphene substrate; (b): Raman spectra of 2-NT molecule;(c): Raman mapping image of the intensity of peak at 750 cm-1 of 2-NT;(d): Raman mapping of the intensity at line A-B shown inFig.3 (c);(e): Raman spectra of DMAB generated from 4 NBT photocatalysis reaction;(f): Schematic diagram of photocatalytic reaction mechanism based on graphene substrate
(a): Optical microscope image of graphene substrate; (b): Raman spectra of 2-NT molecule;(c): Raman mapping image of the intensity of peak at 750 cm-1 of 2-NT;(d): Raman mapping of the intensity at line A-B shown in
Fig. 4. Characteristics of reverse photocatalytic reaction based on graphene substrate
(a): Raman spectra of PATP generated from DMAB reverse photocatalytic reaction;(b): Raman mapping image of the intensity of peak of 1 084 cm-1 of PATP;(c): Raman mapping image of the intensity of peak at 1 450 cm-1 DMAB
(a): Raman spectra of PATP generated from DMAB reverse photocatalytic reaction;(b): Raman mapping image of the intensity of peak of 1 084 cm-1 of PATP;(c): Raman mapping image of the intensity of peak at 1 450 cm-1 DMAB

Set citation alerts for the article
Please enter your email address
© Copyright 2018-2021 | Chinese Laser Press. All Rights Reserved 沪ICP备15018463号-20