A background removal method based on two-dimensional notch filtering in the frequency domain for polarization interference imaging spectrometers (PIISs) is implemented. According to the relationship between the spatial domain and the frequency domain, the notch filter is designed with several parameters of PIISs, and the interferogram without a background is obtained. Both the simulated and the experimental results demonstrate that the background removal method is feasible and robust with a high processing speed. In addition, this method can reduce the noise level of the reconstructed spectrum, and it is insusceptible to a complicated background, compared with the polynomial fitting and empirical mode decomposition (EMD) methods.
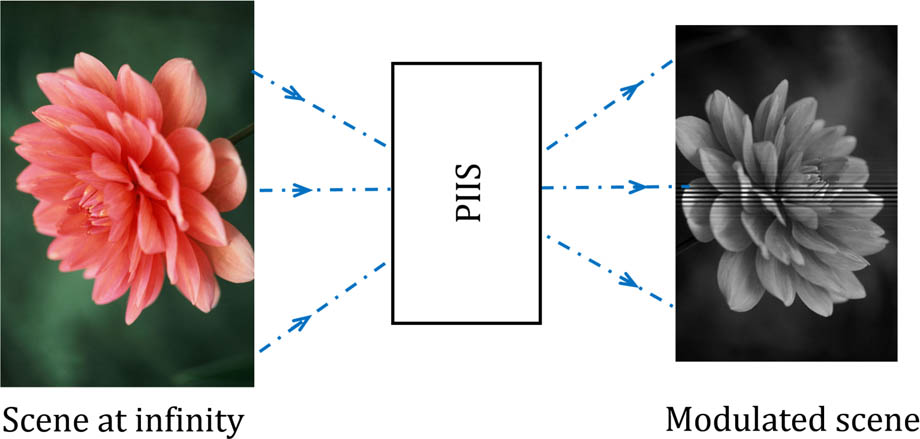
Image and spectrum offer us important information on the characteristics of the object. Fourier transform imaging spectrometers (FTISs) are powerful instruments used in the fields of imaging spectroscopy[1,2]. They can acquire the image and spectrum of the object at the same time and have wide applications in remote environmental monitoring[2–5], atmospheric measurements[6], observations of distant objects[7,8], and biomedical fields[9,10]. Polarization interference imaging spectrometers (PIISs) are one kind of typical FTIS[11]. However, as is shown in Fig. 1, the raw data acquired by PIISs are a series of physical superpositions of the interferogram and background[12,13].
Figure 1.Data acquisition process of PIIS. The modulated scene is the superposition of the interferogram and the background (fusion generated by computer). The scanning system is not shown.
Therefore, background removal becomes an essential step in the spectral retrieval procedure for PIISs. Other processing steps such as apodization and phase correction are implemented after background removal because the background can introduce false information into the spectrum retrieved by Fourier transform[14]. That false information mixed in the spectrum is difficult to recognize and separate.
There are several existing background removal methods for PIISs. One-dimensional (1D) digital signal processing methods such as differential calculation, polynomial fitting[13,14], and empirical mode decomposition (EMD)[15] are used in most background removal procedures. The differential calculation method is simple with a high speed of computation, but some information will be lost because only points are reserved after processing. In addition, differential calculation is susceptible to noise and a complicated background. The polynomial fitting method is widely used in background removal, but it is not suitable to a complicated background because higher order fitting is needed. The EMD method is a self-adaptive method that can get the background without prior knowledge[15]. However, the interpolation algorithm used in EMD needs heavy computation, which affects the speed of the algorithm[15]. Mu et al.[16] proposed an optical assistant method to overcome the drawbacks of digital signal processing methods, but the limitation of their system is that all polarizers must be placed at ideal positions. In practical applications, digital image processing methods have better adaptability and can be applied to different PIISs more easily.
Sign up for Chinese Optics Letters TOC. Get the latest issue of Chinese Optics Letters delivered right to you!Sign up now
Notch filtering in the frequency domain is a powerful tool for feature extraction in two-dimensional (2D) image processing that can extract the frequency of the useful features in the frequency domain by a special notch filter. It has been successfully employed in various applications[17–19]. However, background removal based on 2D notch filtering for PIISs has not been reported. In this Letter, we present a background removal method based on notch filtering in the frequency domain for PIISs. This method has some obvious advantages compared with existing background removal methods. First, it is easy to implement and can be designed easily with several parameters of the PIISs. Second, it needs less computation than polynomial fitting and EMD. Finally, it is robust; the notch filter needs no change in different application situations for a certain PIIS because of its insusceptibility to a complicated background.
What we obtained from a PIIS is a series of images in which an interferogram and a background are superimposed. Digital image processing can be used to extract the interferogram. The principle of the method we described here is based on a 2D Fourier transform for digital images[20,21]. The core of the method is to design a proper notch filter for a specific PIIS. The relationship between the spatial domain and the frequency domain needs to be found. The 2D discrete Fourier transform can be described as[20,21]where is an image with a size of . Under the condition of two beam interference, the widths of the interference fringes are proportional to the wavelength of the incident light. In the 2D Fourier transform process, the image in the spatial domain is transformed to the frequency domain in which different spatial frequencies of the image are distributed along a special direction in terms of intensity. In the image of the frequency domain, after a Fourier transform shift, the central region always represents the lower frequency while the edge region represents the higher frequency[20,21]. Moreover, the frequencies are not relevant in the horizontal and vertical directions, which allows us to extract the frequencies we are interested in. For the vertical fringes, according to the correspondence between the spatial domain and the frequency domain, the relationship between their period in the spatial domain and frequency can be described as where is the frequency of the fringes and is their period in the spatial domain, is the width of the image, and all the variable values are expressed by pixel numbers. To the typical interferogram interference fringes fluctuate remarkably in the horizontal direction and mostly do not change in the vertical direction. The filter can be designed based on that characteristic.
In most PIISs, the interferogram fringes are vertical. We can get the notch filter by calculating the horizontal spatial frequency of the interferogram. Suppose that the detecting wavelength range is from to , according to the Nyquist sampling theorem the thinnest interference light fringes must be sampled by at least one column pixel[14]. That is to say, in every interference fringe changing period the signal of the interferogram must be sampled twice, which also meets the need of making the best use of the detector. When the Nyquist sampling theorem is considered, the period of the interference fringes of the minimum wavelength is 2 pixels and the period of the maximum wavelength’s interference fringes can be calculated by
To monochromatic light, the interferogram fringes have only one frequency, which is a point in the frequency domain and can be directly acquired by allowing that region to pass. When the incident light is polychromatic, the passband in the frequency domain needs to be expanded. It becomes a linear region that lets the frequencies from to pass. It is reasonable because polychromatic light is the superposition of a series of monochromatic lights whose interferograms are overlaid at the same time. So the frequency of the fringes of polychromatic light is the sum of the frequencies of the monochromatic light fringes. Using Eq. (2), the values of and in the frequency domain can be calculated, which are the two ends of the passband, and the notch filter can be designed easily. One thing to note is that the notch filter is a specially designed one to fit the parameters of a special PIIS.
The structure of the notch filter is shown in Fig. 2. It has the same size as the frequency image. Both in our simulation and experiment, the size of the image is , and the wavelength range is from 480 to 960 nm. According to Eqs. (2) and (3), the two ends of the passband are the 256th pixel and the 128th pixel. It should be noted that the center pixel in the image is the 1st pixel because of the symmetry of the frequency domain. So in the frequency image, the values of the 1st pixel to the 128th pixel and the 385th pixel to the 512th pixel in the center row are 1. The values of the rest of the pixels are 0 to block the unneeded frequency. In many practical applications, several excess pixels near the passband are assigned to 1, or values between 0 and 1, to reduce the negative effects of the ringing effect and some other errors caused by fringe inclination. As is shown in Fig. 2, we expanded the width of the passband to about 20 pixels and the values in the passband are assigned from 1 to 0 smoothly according to its distance to the central passband line. For a certain PIIS, the filter can be used in various situations without modification.
Figure 2.Structure of the notch filter. The size of the filter is ; the different colors represent the value of the filter; the maximum value is 1, and the minimum value is 0.
In our simulation, a polychromatic spectrum and its 2D interferogram were constructed. A simple background with random noise was added to the interferogram. The complete filtering procedure is shown in Fig. 3. First, the original image was transformed to the frequency domain. Second, the frequency image was multiplied by the notch filter. Finally, we used the frequency passed from the notch filter to reconstruct the interferogram without a background by a 2D inverse Fourier transform. The results are shown in Fig. 4; all the curves were chosen from the same rows in those images of spatial domain.
Figure 3.Filtering procedure for background removal. In the frequency domain, the frequency image was multiplied by the notch filter.
Figure 4.Simulation results of background removal based on notch filtering. (a) The original interferogram overlaid with the background. (b) The background extracted by notch filtering. (c) The interferogram without the background.
It can be seen from Fig. 4 that the background was removed efficiently, and the noise added to the interferogram was partly removed. That result indicates that the notch filtering method can reduce the noise level of the interferogram; therefore, it can increase the SNR of the recovered spectrum. To compare the spectrum restore effect of different background removal methods, we calculated the SNR of the recovered spectrum after background removal using notch filtering, polynomial fitting, and EMD methods. The SNR of the contaminated interferogram is 25 dB and the simulation results are shown in Fig. 5. Comparing with Figs. 5(a) and 5(b), the spectrum restore result in Fig. 5(c) is obviously much better. It is proved that background removal based on notch filtering is feasible and can reduce the noise level of the recovered spectrum; meanwhile, the information of the original spectrum is almost preserved. The SNR of the recovered spectrum after background removal using the polynomial fitting, EMD, and notch filtering methods are 10.73, 9.79, and 16.09 dB, respectively.
Figure 5.Simulation results of spectrum restore effect using different background removal methods: (a) polynomial fitting method, (b) EMD method, (c) notch filtering method. The red dashed dot line represents the original noise free spectrum, and the blue solid line represents the recovered spectrum after background removal using different methods.
It is easy to explain the de-noise effect. Suppose that random noise exists in every frequency; while we are rejecting some special bands in the frequency domain, those frequencies of noise are rejected. So the method can wipe off a part of the noise but not the complete noise, for the frequencies of noise in the passband remains. Even so, the level of noise is still restrained obviously.
In our experiment, a PIIS based on a Savart polariscope was implemented[11]. It uses a CCD detector, and awavelength range of 480 to 960 nm. The scene at infinity was produced by a collimator whose focal length is 3 m. Based on the data acquisition principle of a windowing spectrometer, the original data including the interferogram and images of objects were obtained.
We demonstrated the feasibility of the method and its effect in de-noise by reconstructing the spectrum of a He–Ne laser at 632.8 nm. The laser beam entered into an integrating sphere to get a uniform light source and was collected by the collimator and PIIS. Figure 6 shows the results by comparing the polynomial fitting and the notch filtering methods. It can be seen that in the low SNR part the noise level of the notch filtering method is obviously reduced without reducing the spectrum resolution, which is consistent with the simulation results.
Figure 6.Spectrum of the He–Ne laser reconstructed after background removal using two methods. Red dashed dot line represents the polynomial fitting method, and blue solid line represents the notch filtering method.
In practical applications, the processing speed is always significant. In our experiment, the processing times of different background removal methods were recorded. All the algorithms ran on a computer equipped with an Intel Core i5 2.2 GHz CPU and 8.00 GB RAM, using MATLAB R2014a. Table 1 shows the processing time of an image with a size of using the notch filtering, polynomial fitting, and EMD methods. Background removal based on notch filtering needs much less time to process, which is preferred in practical applications.
Background removal method
Time (s)
Polynomial fitting
4.687
EMD
1856.754
Notch filtering
0.078
Table 1. Processing Time of the Background Removal Methods
When the background is complicated, existing background removal methods are not feasible. However, the notch filtering method can still solve the problem efficiently. In most conditions, the frequency of the background is different from the interferogram, which is the basic guarantee of the notch filtering method. As a result, there is no difference for the method whether the background is complicated. The notch filtering method can get ideal results in most conditions unless the frequency of the background coincides with the interferogram fringes because a 2D Fourier transform cannot distinguish the narrow band that contains adjacent frequencies. But it can be solved by comparing several similar backgrounds in a scan sequence. Figures 7 and 8 show the experimental results observing a complicated scene. Figures 7(a) and 7(b) show the bad processing results by the polynomial fitting and EMD methods when the background is complicated. Figure 7(c) shows a better result by notch filtering, and Fig. 8 is the 2D result of Fig. 7(c).
Figure 7.(a) The result using polynomial fitting method. (b) The result using EMD method. (c) The result using notch filtering method. And BR is the abbreviation of background removal.
In conclusion, notch filtering in the frequency domain is a powerful tool for interferogram background removal for PIISs. It can be implemented easily in various PIISs because no heavy computations with approximations are incurred in the design of the filter. In addition, the special filter for one PIIS can be applied in every scene it acquired without modification. Unlike the existing 1D processing methods, which only remove the background of one row at a time, 2D notch filtering in the frequency domain offers a more efficient way to remove the background of one image at a time, which is preferred in practical applications. It is discovered in our experiment that the notch filtering method can be implemented in the interferogram background removal effectively and robustly, even when the background is complicated. It is also found that the notch filtering method can reduce the noise level in the interferogram to improve the SNR of the spectrum. The limitation of this method is the ring-bell effect that introduces some false information into the interferogram. But the effect can be eliminated easily by apodization because it only exists in the positions of maximum optical path difference of the interferogram.
[17] D. Yazdani, A. Bakhshai, G. Joos, M. Mojiri. Proceedings of the IEEE International Symposium on Industrial Electronics, 226(2008).
[18] I. Claesson, A. Rossholm. Proceedings of the 5th International Conference on Information, Communications and Signal Processing (ICICS), 1320(2005).
[19] N. Chandra, B. D. Man. System and method of notch filtration for dual energy CT. U.S. patent(2012).
[20] N. Sandirasegaram, R. English. Proc. SPIE, 42, L724(2003).