• Journal of Geographical Sciences
  • Vol. 30, Issue 10, 1702 (2020)
Lihua YUAN1, Changqing SONG1、2、*, Changxiu CHENG1、2, Shi SHEN1、2, Xiaoqiang CHEN1, and Yuanhui WANG1
Author Affiliations
  • 1Center for GeoData and Analysis, Faculty of Geographical Science, Beijing Normal University, Beijing 100875, China
  • 2State Key Laboratory of Earth Surface Processes and Resource Ecology, Beijing Normal University, Beijing 100875, China
  • show less
    DOI: 10.1007/s11442-020-1808-6 Cite this Article
    Lihua YUAN, Changqing SONG, Changxiu CHENG, Shi SHEN, Xiaoqiang CHEN, Yuanhui WANG. The cooperative and conflictual interactions between the United States, Russia, and China: A quantitative analysis of event data[J]. Journal of Geographical Sciences, 2020, 30(10): 1702 Copy Citation Text show less
    Numbers and scales of cooperation and conflict between the three dyads in two periods(Note: The ratio in Figures 1b and 1d denotes the ratio of absolute scales of conflict to cooperation between dyad countries.)
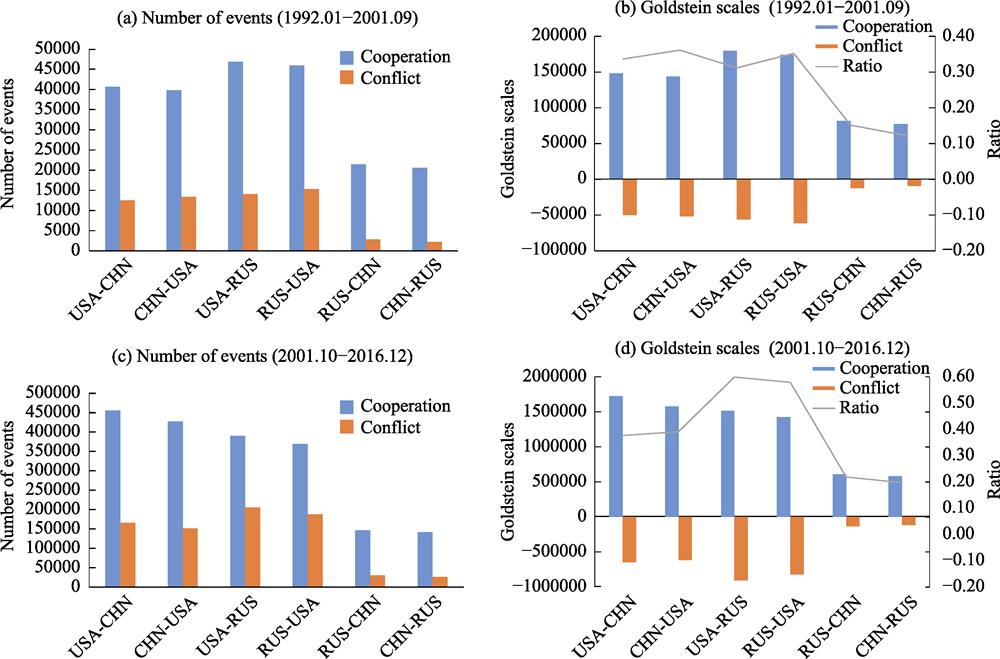
    Fig. 1. Numbers and scales of cooperation and conflict between the three dyads in two periods(Note: The ratio in Figures 1b and 1d denotes the ratio of absolute scales of conflict to cooperation between dyad countries.)
    Goldstein scales of conflict and cooperation between the USA and Russia in 2001.10-2016.12 period
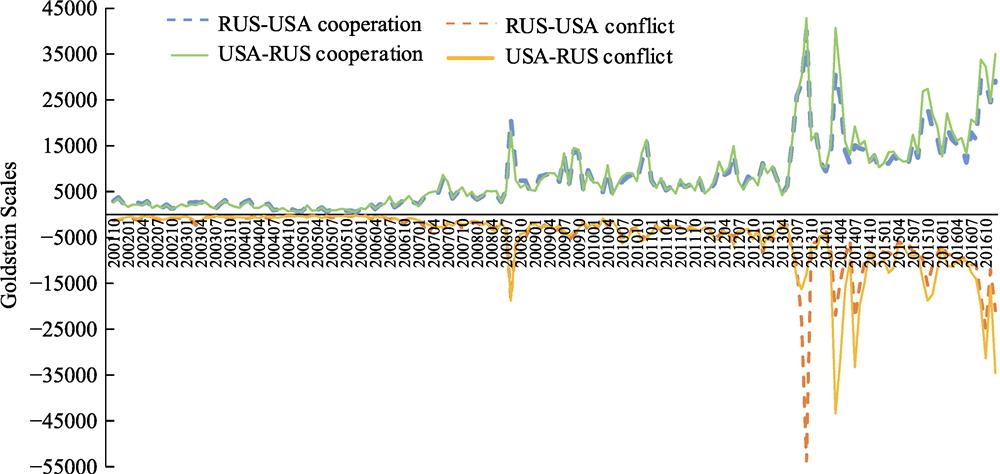
    Fig. 2. Goldstein scales of conflict and cooperation between the USA and Russia in 2001.10-2016.12 period
    The log-log plot of CCDF of the absolute cooperative and conflictual scales between the USA and China (Note: USA-CHN and CHN-USA mean the scales sent from the USA to China and those from China to the USA, respectively.)
    Fig. 3. The log-log plot of CCDF of the absolute cooperative and conflictual scales between the USA and China (Note: USA-CHN and CHN-USA mean the scales sent from the USA to China and those from China to the USA, respectively.)
    The log-log plot of CCDF of the absolute cooperative and conflictual scales between the USA and Russia (Note: USA-RUS and RUS-USA mean the scales sent from the USA to Russia and those from Russia to the USA, respectively.)
    Fig. 4. The log-log plot of CCDF of the absolute cooperative and conflictual scales between the USA and Russia (Note: USA-RUS and RUS-USA mean the scales sent from the USA to Russia and those from Russia to the USA, respectively.)
    The log-log plot of CCDF of the absolute cooperative and conflictual scales between Russia and China (Note: RUS-CHN and CHN-RUS mean the scales sent from Russia to China and those from China to Russia, respectively.)
    Fig. 5. The log-log plot of CCDF of the absolute cooperative and conflictual scales between Russia and China (Note: RUS-CHN and CHN-RUS mean the scales sent from Russia to China and those from China to Russia, respectively.)
    DyadsDirectionVariablesDescriptions of variables
    USA-CHN dyadUSA-CHNUCp, UCfScales of cooperative/conflictual behavior from the USA toward China
    CHN-USACUp, CUfScales of cooperative/conflictual behavior from China toward the USA
    USA-RUS dyadUSA-RUSURp, URfScales of cooperative/conflictual behavior from the USA toward Russia
    RUS-USARUp, RUfScales of cooperative/conflictual behavior from Russia toward the USA
    RUS-CHN dyadRUS-CHNRCp, RCfScales of cooperative/conflictual behavior from Russia toward China
    RUS-CHNCRp, CRfScales of cooperative/conflictual behavior from China toward Russia
    Table 1.

    Descriptions of the monthly time-series variables

    Independent variables1992.01-2001.09 period2001.10-2016.12 period
    Dependent variableDependent variable
    UCpCUpUCfCUfUCpCUpUCfCUf
    UCp(-1)-0.038***0.091**0.159*-0.7670.6810.615
    CUp(-1)0.649-0.090**0.3890.572-0.3060.234
    URp(-1)0.2960.4600.161*0.5430.052**0.033***0.054**0.571
    RUp(-1)0.2640.3830.2080.8490.156*0.146*0.2240.633
    RCp(-1)0.007***0.019***0.3280.024***0.4440.3420.5030.619
    CRp(-1)0.007***0.018***0.3820.018***0.4320.3310.3190.646
    UCf(-1)0.8660.754-0.149*0.027***0.031*-0.010***
    CUf(-1)0.2950.5370.042***-0.7600.6980.269-
    URf(-1)0.143*0.2100.146*0.012***0.8330.8360.083**0.078**
    RUf(-1)0.8720.8730.9330.8670.8560.9790.101*0.550
    RCf(-1)0.2230.4850.3570.8800.127*0.055**0.2830.671
    CRf(-1)0.4730.5610.4960.6690.5570.2530.8290.731
    R20.7260.7130.5580.5700.8920.8970.9120.914
    Adjusted R20.6940.6800.5060.5190.8840.8900.9050.908
    F-statistic22.74121.32010.82611.356115.926122.708145.113149.057
    Table 2.

    The significance level of the Granger/Wald test of the USA-China dyad in both periods

    Independent variables1992.01-2001.09 period2001.10-2016.12 period
    Dependent variableDependent variable
    URpRUpURfRUfURpRUpURfRUf
    UCp(-1)0.7590.6420.4310.190*0.0970.060**0.6780.720
    CUp(-1)0.8420.7190.5680.2730.055**0.032***0.6420.840
    URp(-1)-0.5790.3040.123*-0.8270.7620.900
    RUp(-1)0.112*-0.163*0.113*0.856-0.8050.766
    RCp(-1)0.5180.3880.5040.7530.9300.8620.8870.916
    CRp(-1)0.2500.166*0.3380.5350.9440.8780.9270.938
    UCf(-1)0.8320.7700.6560.9190.057**0.049***0.3080.208
    CUf(-1)0.6510.3870.7960.8780.9370.7200.4600.644
    URf(-1)0.3910.626-0.3320.123*0.159*-0.003***
    RUf(-1)0.8630.5590.511-0.4300.2870.787-
    RCf(-1)0.9690.9580.7230.5850.4160.4700.3460.675
    CRf(-1)0.9780.9410.5420.6050.6040.4280.8860.535
    R20.5530.5400.5970.6040.8690.8690.8800.849
    Adjusted R20.5010.4860.5500.5580.8600.8600.8720.839
    F-statistic10.62810.07512.70713.09393.76993.501103.57279.374
    Table 3.

    The significance level of the Granger/Wald test of the USA-Russia dyad in both periods

    Independent variables1992.01-2001.09 period2001.10-2016.12 period
    Dependent variableDependent variable
    RCpCRpRCfCRfRCpCRpRCfCRf
    UCp(-1)0.9190.7950.9500.5530.4450.4460.6130.339
    CUp(-1)0.6730.8070.6260.7280.2360.2630.8560.538
    URp(-1)0.6270.5020.5980.0910.011***0.011***0.3120.172*
    RUp(-1)0.7320.6810.9140.044***0.007***0.009***0.2770.163*
    RCp(-1)-0.6010.9110.119*-0.8450.7450.799
    CRp(-1)0.480-0.9710.4150.696-0.8510.603
    UCf(-1)0.006***0.001***0.9730.6080.5140.6610.5810.777
    CUf(-1)0.004***0.001***0.6140.6020.3030.3980.3590.195*
    URf(-1)0.9650.4530.131*0.048***0.062**0.153*0.028***0.195*
    RUf(-1)0.7450.6700.187*0.9050.5660.8330.181*0.360
    RCf(-1)0.000***0.000***-0.8870.2720.214-0.198*
    CRf(-1)0.001***0.000***0.054**-0.184*0.2020.917-
    R20.5390.5610.4440.4540.6920.6840.6820.695
    Adj. R20.4850.5090.3790.3910.6700.6620.6590.673
    F-statistic10.02410.9476.8457.14531.61630.52430.18032.109
    Table 4.

    The significance level of the Granger/Wald test of China-Russia dyad in both periods

    Lihua YUAN, Changqing SONG, Changxiu CHENG, Shi SHEN, Xiaoqiang CHEN, Yuanhui WANG. The cooperative and conflictual interactions between the United States, Russia, and China: A quantitative analysis of event data[J]. Journal of Geographical Sciences, 2020, 30(10): 1702
    Download Citation