• Journal of Geographical Sciences
  • Vol. 30, Issue 10, 1702 (2020)
Lihua YUAN1, Changqing SONG1、2、*, Changxiu CHENG1、2, Shi SHEN1、2, Xiaoqiang CHEN1, and Yuanhui WANG1
Author Affiliations
  • 1Center for GeoData and Analysis, Faculty of Geographical Science, Beijing Normal University, Beijing 100875, China
  • 2State Key Laboratory of Earth Surface Processes and Resource Ecology, Beijing Normal University, Beijing 100875, China
  • show less
    DOI: 10.1007/s11442-020-1808-6 Cite this Article
    Lihua YUAN, Changqing SONG, Changxiu CHENG, Shi SHEN, Xiaoqiang CHEN, Yuanhui WANG. The cooperative and conflictual interactions between the United States, Russia, and China: A quantitative analysis of event data[J]. Journal of Geographical Sciences, 2020, 30(10): 1702 Copy Citation Text show less

    Abstract

    The United States, Russia and China are militarily and economically among the most powerful countries in the post-Cold War period, and the interactions between the three powers heavily influence the international system. However, different conclusions about this question are generally made by researchers through qualitative analysis, and it is necessary to objectively and quantitatively investigate their interactions. Monthly-aggregated event data from the Global Data on Events, Location and Tone (GDELT) to measure cooperative and conflictual interactions between the three powers, and the complementary cumulative distribution function (CCDF) and the vector autoregression (VAR) method are utilized to investigate their interactions in two periods: January, 1991 to September, 2001, and October, 2001 to December, 2016. The results of frequencies and strengths analysis showed that: the frequencies and strengths of USA-China interactions slightly exceeded those of USA-Russia interactions and became the dominant interactions in the second period. Although that cooperation prevailed in the three dyads in two periods, the conflictual interactions between the USA and Russia tended to be more intense in the second period, mainly related to the strategic contradiction between the USA and Russia, especially in Georgia, Ukraine and Syria. The results of CCDF indicated that similar probabilities in the cooperative behaviors between the three dyads, but the differences in the probabilities of conflictual behaviors in the USA-Russia dyad showed complicated characteristic, and those between Russia and China indicated that Russia had been consistently giving China a hard time in both periods when dealing with conflict. The USA was always an essential factor in affecting the interactions between Russia and China in both periods, but China’s behavior only played a limited role in influencing the interactions between the USA-Russia dyad. Our study provides quantitative insight into the direct cooperative and conflictual interactions between the three dyads since the end of the Cold War and helps to understand their interactions better.

    1 Introduction

    Fundamental changes have taken place in the structure of the international system since the end of the Cold War; moreover, changes in the mutual interest and demand between the three major powers-the United States, Russia and China, have resulted in fundamental changes to the nature of their interactions (Kornberg, 1996; Kalyvas and Balcells, 2010; Pang and Liu, 2019). As the most critical triangular interactions in post-Cold War international politics, the interactions between these three major powers will significantly affect the international system and regional situations (Guo 2002; Gladkyy, 2003; Li, 2017; Zhao, 2018). Therefore, their interactions are perennial focuses of the international community, and continue to constitute a core issue in the academic arena. So, how do they interact between each other after the end of the Cold War? How do the interactions between one dyad affect the other dyad behaviors toward each other? However, different conclusions about this question are generally made by many researchers based on the combination of international events and the experience of themselves, theoretical preferences, or both (Chi and Hou, 2019). Therefore, there is a need to analyze their interactions objectively and provide a better understanding by applying quantitative data and methods.

    Along with the emergence of big data and computational social science (Cukier and Mayer-Schoenberger, 2013; Lazer et al., 2014), quantifying the relationships between the countries by using numerous events occurring between the countries and statistical methods offers a good way of understanding their relationships (Leetaru and Schrodt, 2013; Gao et al., 2013). The open-accessed and massive event database—the Global Data on Events, Location and Tone (GDELT), introduced in 2013-can provide massive event data for conducting a quantitative investigation of the interactions between the three countries. Currently, GDELT data has been utilized in the fields of geography (Yuan et al., 2017; Levin et al., 2018; Chen et al., 2019; Liu et al., 2019; Ma et al., 2019; Shen et al., 2019), political science (Yonamine, 2013; Abb and Strüver, 2015; Gonzalo et al., 2015; Li, 2015; Pang and Liu, 2019; Zhang et al., 2019), economics (Elshendy and Fronzetti, 2017; Theocharous et al., 2018) and other fields (Bodas-Sagi and Labeaga, 2016). GDELT uses a machine-coded method to extract events from global prints, broadcasts, and media in over 65 languages from 1979 to the present and then codes the events into nearly 300 sub-classes of 20 categories with weights (Leetaru and Schrodt, 2013; Shen et al., 2020). The format of the event is recorded as “who did what to whom,” and has the time, location, and specific event type assigned to a fixed weight between -10 and +10 to measure the different levels of conflict and cooperation in interstate relationships according to Goldstein scales, which is a way to assign weights to types of events proposed by Goldstein (1992) . The value ranges from -10 for the most conflictual events (e.g., military attacks) and +10 for the most cooperative events (e.g., military retreat). Generally, the scales or numbers of events during a specific period sent from country A to country B and those sent from country B to country A are used as measures to present the interactions between two countries in the quantitative analysis.

    Scholars have used event data to analyze interstate interactions for decades. However, most of the existing quantitative literature that uses event data to analyze the interactions between the three countries is focused on the Cold War period. Manually coded event datasets of the Conflict and Peace Data Bank (COPDAB), available from 1948 to 1978 (Azar, 1980), and the World Events Interaction Survey (WEIS), available from 1966 to the 1990s (Azar, 1980), were mostly used to quantitatively study the superpower relations, as well as the relationships between politics and trade during the Cold War period. For instance, Ward (1982), Dixon (1986) , McGinnis and Williams (1989) , and Goldstein (1991) utilized COPDAB and WEIS event data to explore USA-Soviet relations during the Cold War period quantitatively. Meanwhile, several empirical studies investigated the USA-Soviet-China interactions. Rajmaira and Ward (1990) examined the dyadic relationships among the three countries from the 1950s to the 1970s as based on COPDAB and WEIS. Goldstein and Freeman (1991) and Goldstein (1992) combined event data-COPDAB, WEIS, and ASHLEY-to quantitatively investigate USA-Soviet-China interactions from the 1950s to the 1980s, and showed the importance of reciprocity and the third country’s influence in their interactions. Kang and Reuveny (2000) studied the political interactions among the USA, Soviet, China, Japan, and (West) Germany from 1980 to 1991 based on the COPDAB and WEIS data. They found that minor powers significantly influenced bilateral or trilateral relations between the superpowers. These quantitative studies placed the interactions between the major powers on strong empirical footings and yielded new insights into their policy-making during the Cold War period.

    The interactions between the USA, Russia and China after the end of the Cold War are fundamentally different from those during the Cold War period (Guo 2002; Gladkyy, 2003; Zhao, 2018). However, only a limited number of quantitative studies based on event data investigate their post-Cold War interactions. For example, Li (2002) analyzed the conflict and cooperation level of USA-China relations from 1993 to 2000 by using monthly-aggregated weights based on the events obtained from the People’s Daily and found that cooperation was the mainstream and the two sides’ interactions were generally at the same level. Yan’s team (Yan, 2010, Yan and Qi, 2012) from Tsinghua University revealed the monthly bilateral relations between USA-China dyad and Russia-China dyad by manually coding and aggregating the event data monthly from China’s perspective. Their work provides available data for empirical research on bilateral relations. However, these data cannot distinguish between the sending country and the receiver because of the nature of mixed time-series of weights of events that occurred between two countries; and might suffer the “under-report bias” as Chinese media is their main sources of the news (Weidmann, 2016). The emergence of open-accessed GDELT data with multiple sources has been used in quantifying the relations between countries (Abb and Strüver, 2015; Chen et al., 2019, Shen et al., 2019, Pang and Liu, 2019). Shen et al. (2019) explored the differences and persistent characteristics of the cooperative and conflictual interactions between the USA and China using the CCDF (complementary cumulative distribution function) method and Hurst method, based on the monthly aggregated dyad Goldstein scales from GDELT since 1979. Pang and Liu (2019) used the vector autoregression (VAR) model to investigate the interactions between the USA and China based on the weekly averaged Goldstein scales and found that Russia significantly influenced the interactions between China and the USA. The two studies used statistical methods and time-series scales of event data to investigate the interactions between the USA and China, and both contributed to an understanding of the USA-China interactions. However, the interactions between the three dyads (the USA and China, the USA and Russia, as well as Russia and China) have not been sufficiently studied using GDELT data. The usage of taking the averaged scale of events cannot capture whether the cooperative and conflictual behaviors between countries would interact, and thus cannot examine the interdependence of the cooperative and conflictual interactions between the three dyads.

    Therefore, our objective is to investigate the cooperative and conflictual interactions between the USA, Russia and China using the temporal scales of event data from GDELT from 1992 to 2016, aiming at providing a quantitative insight into the interactions between the three dyads. Specifically, we utilize twelve monthly-aggregated variables (six cooperative and six conflictual variables) between the three countries obtained from the GDELT and the CCDF method and the VAR model to study their direct cooperative and conflictual interactions between the three dyads, including analyzing the frequencies and intensities of their interactions, the differences in the degree of their cooperative and conflictual behaviors, as well as the interdependence of their cooperative and conflictual interactions between the three dyads.

    The remainder of this paper proceeds as follows. Section 2 briefly introduces our research design, describes the measures of cooperation and conflict data obtained from GDELT, and briefly introduces the CCDF and the VAR method. We present and analyze the results of the CCDF method and the VAR model in Section 3. Lastly, we provide a conclusion and discussion of the results and directions for future work in Section 4.

    2 Data and methods

    This section includes three parts. First, we illustrate the division of the study period from January, 1992 to December, 2016 based on the occurrence of the terrorist attacks on September 11, 2001. The first period is from January, 1991 to September, 2001, and the second is from October 2001 to December 2016. Second, we describe the event data from GDELT and the constructed measures to represent the cooperative and conflictual behaviors between the three dyads. Lastly, we briefly introduce the CCDF and the VAR method.

    2.1 Division of the study period

    To explore the temporal characteristics of the three dyads’ interactions, the leadership changes in each country, any major international incidents in which the great powers were involved, and statistical method were generally used to divide the time periods (Goldstein and Freeman, 1991; Ward and Rajmaira, 1992; Li and Kong, 2010; Chen et al.; 2019; Pang and Liu, 2019; Shen et al.; 2019). In this study, we followed the second proposal. According to the extent studies, the terrorist attacks on September 11, 2001 (9/11 for simplicity) in New York and Washington, DC, brought about changes in foreign policies of the USA to emphasize security. As a result, 9/11 led to notable changes in the relations between the USA and Russia, as well as the USA and China (Gladkyy, 2003; Li and Kong, 2010). Therefore, we divided 1992 to 2016 into two periods: the first period was from January 1991 to September 2001, and the second period was from October 2001 to December 2016, we would analyze the cooperative and conflictual interactions between the three dyads in the two periods in section 3.

    2.2 Data source and measures of cooperation and conflict

    The data used in this paper ranging from January 1992 to December 2016 were obtained from GDELT (https://www.gdeltproject.org). The unit of analysis was cooperative/ conflictual Goldstein scales (scales for simplicity) sent from one country to one of the other two in each month. There were three bilateral relations, each of which was composed of four directional behaviors, for example, UCp, UCf and CUp, CUf showed in Table 1. UCp and UCf denoted the cooperative and conflictual behaviors sent from the USA to China, respectively, and CUp and CUf meant the corresponding cooperative and conflictual behaviors sent from China to the USA, respectively. Therefore, we constructed twelve variables for the three dyads, whose denotation and descriptions are shown in Table 1. Further analysis about these variables will be described in Section 3 by using the quantitative methods.

    DyadsDirectionVariablesDescriptions of variables
    USA-CHN dyadUSA-CHNUCp, UCfScales of cooperative/conflictual behavior from the USA toward China
    CHN-USACUp, CUfScales of cooperative/conflictual behavior from China toward the USA
    USA-RUS dyadUSA-RUSURp, URfScales of cooperative/conflictual behavior from the USA toward Russia
    RUS-USARUp, RUfScales of cooperative/conflictual behavior from Russia toward the USA
    RUS-CHN dyadRUS-CHNRCp, RCfScales of cooperative/conflictual behavior from Russia toward China
    RUS-CHNCRp, CRfScales of cooperative/conflictual behavior from China toward Russia

    Table 1.

    Descriptions of the monthly time-series variables

    There are several advantages of using GDELT data. First, the time range of events in GDELT spans from 1979 to the present and covers our research period. The temporal resolution of events is daily and thus allows to be monthly-aggregated to capture interactions between countries, but some bilateral data (e.g., United Nations Assembly votes) can only provide annual data. Second, GDELT collects news data from extensive sources in more than 65 languages from all over the world, and thus help to avoid the problem of selective bias. For example, Ma et al. (2017) had demonstrated that reports on the same event from different sources were consistent in judging the cooperative or conflictual levels. Third, the conflict-cooperation scales of events in GDELT to the present interactions between countries/regions are in line with the facts (Li, 2015). Lastly, the GDELT data is directional (e.g., cooperative/conflict scales sent from country A to country B and those sent from country B to country A), while some bilateral data (e.g., United Nations Assembly votes) cannot capture the direction of dyad countries’ behaviors. This characteristic of GDELT helps to analyze dyad countries’ interactions clearer. Based on the above, we consider that GDELT data is appropriate for our study.

    The reasons for adopting monthly-aggregated data as the unit of analysis are as follows. Noise will be included in daily-aggregated or weekly-aggregated data (Yonamine, 2013) and short-term interactions within one year might not be captured by annually-aggregated data (Goldstein, 1991; Gonzalo et al., 2015). Therefore, monthly aggregated data are appropriate for they can avoid the inclusion of too many previous lags in the VAR model, which leads to the estimation inefficiency, and capture the long-term and short-term dynamics. Considering the above, we select monthly-aggregated cooperation and conflict scales data.

    2.3 Methods

    The CCDF method has been introduced to estimate distributions and examine the differences in the degree of cooperative and conflictual behaviors between the USA and China (Shen et al., 2019). It is given by: s. Here, we use the CCDF to estimate distributions and investigate the differences in the degree of cooperative and conflictual behaviors between the three dyads. The CCDF method for three dyads was implemented in Matlab 2017 software.

    The VAR model is applied to analyze the interdependence of the cooperative and conflictual interactions between the three dyads. The VAR model was initially proposed by Sims (1980) to explore the interactions among macro-economic variables and it was introduced to study the interactions between countries (e.g. Goldstein, 1991; Kang and Reuveny, 2000; Pang and Liu, 2019). We selected the VAR model for its flexible nature that does not require any presumptions (or restrictions) on the direction of the causality between variables (Lu, 2001). In this analysis, the VAR model was a multi-equation model in which each country’s recent prior behaviors directed at each other are included on the right-hand side of each equation. Our VAR model included 12 equations for the three dyads in each period. The dependent variable on the left of each equation is the cooperation/conflict flow sent from one country to the other two, and the independent variables on the right were lagged-terms of six cooperation flows and six conflict flows between the three dyads. To save space, only one equation is given to illustrate the VAR model.

    $\begin{align} & UC_{p}^{t}=\sum{_{i=1}^{m}}{{\beta }_{11i}}UC_{p}^{t-i}+\sum{_{i=1}^{m}}{{\beta }_{12i}}CU_{p}^{t-i}+\sum{_{i=1}^{m}}{{\beta }_{13i}}UR_{p}^{t-i}+\sum{_{i=1}^{m}}{{\beta }_{14i}}RU_{p}^{t-i}+ \\ & \ \ \ \ \ \ \ \ \ \ \sum{_{i=1}^{m}}{{\beta }_{15i}}RC_{p}^{t-i}+\sum{_{i=1}^{m}}{{\beta }_{16i}}CR_{p}^{t-i}+\sum{_{i=1}^{m}}{{\beta }_{17i}}UC_{f}^{t-i}+\sum{_{i=1}^{m}}{{\beta }_{18i}}CU_{f}^{t-i}+ \\ & \ \ \ \ \ \ \ \ \ \ \sum{_{i=1}^{m}}{{\beta }_{19i}}UR_{f}^{t-i}+\sum{_{i=1}^{m}}{{\beta }_{120i}}RU_{f}^{t-i}+\sum{_{i=1}^{m}}{{\beta }_{121i}}RC_{f}^{t-i}+\sum{_{i=1}^{m}}{{\beta }_{122i}}CR_{f}^{t-i}+{{\alpha }_{10}}+{{\mu }_{1t}} \\ \end{align}$

    where U, R and C denote the USA, Russia and China, respectively; p and f represent cooperation and conflict, respectively; UCtp represent the cooperative behaviors sent from the USA toward China at time t, and so forth; m is the number of lags of right-hand variables; β’s are the coefficients; α and u are the constant term and error term, respectively.

    Before performing the VAR model, it is necessary to explore the stationarity of time-series variables. A commonly used method—the Augmented Dickey-Fuller (ADF) test (Dickey and Fuller, 1979, 1981) was utilized. The results of the ADF test for all of the variables of the first period (n = 117 months) and the second period (n = 183 months) were stationary at the 5% significance level. Second, once the stationarity of the variables was confirmed, the lag length in the VAR model was to be determined by criteria including the likelihood ratio test (LR), Akaike’s Final Prediction Error (FPE) criterion, Akaike’s Information Criterion (AIC), Schwartz Information Criterion (SIC) and the Hannan-Quinn Information Criterion (HQIC). These four criteria indicated that one lag was the optimal lag in both two VAR models. Thus, we conducted the VAR models with one lag and employed the Autoregression (AR) root method to examine whether each estimated VAR model was stable. The results of the AR root test showed that the inverse roots lay within the unit circles, indicating that the two estimated VAR models satisfied the stability condition. Last, we performed the Granger causality/Wald Test to examine the significance of the estimated coefficients (Kang and Reuveny, 2001). If the coefficients on the one-lagged variables were significantly different from zero, this indicated Granger Causality running from one variable to another.

    3 Results

    3.1 The frequencies and intensities of the interactions

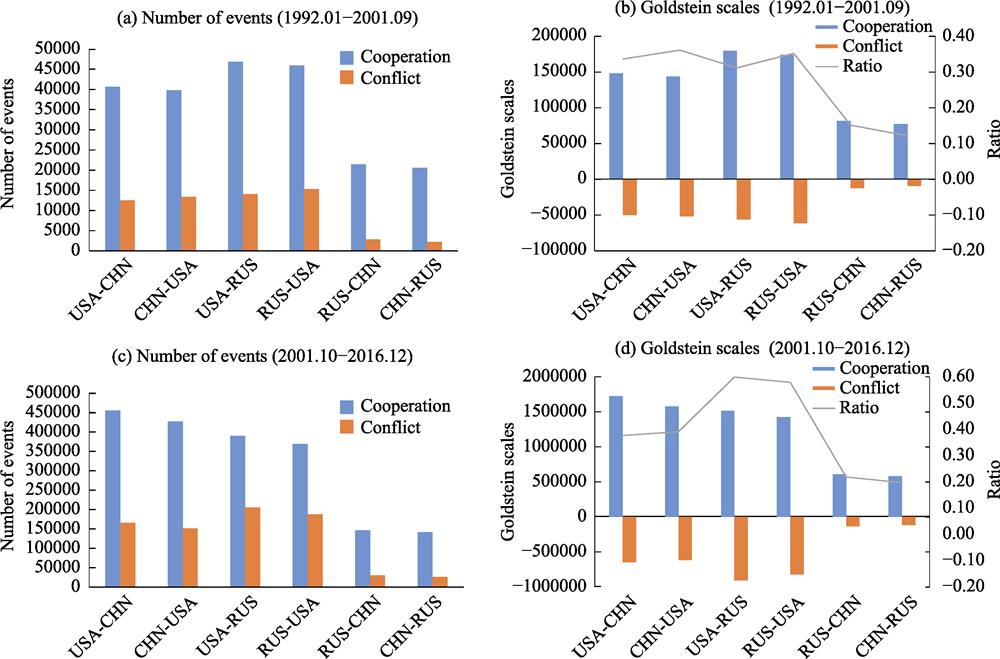
    To understand the overall characteristics of the cooperative and conflictual interactions between the dyads of USA-China, USA-Russia and Russia-China, we briefly analyze the frequencies and intensities of the cooperative and conflictual interactions as indicated by the summed-up amounts and summed-up scales of events between the three dyads. The total numbers and scales of cooperation and conflict between the three dyads are displayed in Figure 1.

    In the period from 1992.01 to 2001.09, as shown in Figures 1a and 1b, it can be seen that the amounts and absolute values of scales of cooperation and conflict between the USA and Russia were both highest, followed by the those between the USA and China, while those between Russia and China were the least in the three dyads. However, the frequencies and intensities of the interactions between the USA and China, as indicated by the numbers and absolute scales in 2001.10-2016.12 displayed in Figures 1c and 1d, slightly exceeded those between the USA and Russia to become dominant in the three dyad interactions. This result indicated that China received more attention due to its growing strength, especially China’s GDP went up from the 6th in 2001 to the 2nd in 2016 in the world, and China’s ranking in goods trade rose from the fourth-largest in 2001 to the second-largest country in 2016.

    Numbers and scales of cooperation and conflict between the three dyads in two periods(Note: The ratio in Figures 1b and 1d denotes the ratio of absolute scales of conflict to cooperation between dyad countries.)

    Figure 1.Numbers and scales of cooperation and conflict between the three dyads in two periods(Note: The ratio in Figures 1b and 1d denotes the ratio of absolute scales of conflict to cooperation between dyad countries.)

    In both periods, despite prevailing cooperation, there were expanded conflict between the three dyads, as indicated by that the total numbers and absolute scales of cooperation were higher than those of conflict in two periods and the ratio of the conflictual interactions to the cooperative interactions in three dyads in Figures 1b and 1d became larger than their corresponding values in the first period in Figures 1a and 1c. However, the ratio in the dyad of USA-Russia and USA-China were higher than those in the dyad of Russia-China, indicating that conflict in the dyad of USA-Russia and USA-China were stronger than those between Russia and China. In the dyad of USA-Russia in the second period, this ratio increased from 33% to 59% and became the largest ratio, indicating that the conflictual interactions between the USA and Russia intensified, this is mainly related to their geostrategic contradiction, especially in Georgia, Syria and Ukraine, as shown by the troughs and spikes in September 2008, September 2013, March and April 2014 in Figure 2.

    Goldstein scales of conflict and cooperation between the USA and Russia in 2001.10-2016.12 period

    Figure 2.Goldstein scales of conflict and cooperation between the USA and Russia in 2001.10-2016.12 period

    3.2 Differences in the degree of cooperative and conflictual behaviors

    This section will analyze the differences in the degree of cooperative and conflictual behaviors between the three dyads using the CCDF technique. To reliably estimate the distributions of the event scales data with wide-range, we both took logarithm of the cooperative scales and the absolute conflictual scales and then estimated their CCDF, according to the practice in Gao and Hu (2014). The curves in Figures 3-5 display the complementary cumulative distributions of cooperative scales and absolute conflictual scales between the three dyads. The x-axis and y-axis denote the scales (ie., the logarithmized value of absolute scales) and the probability that Xscales, respectively.

    In the dyad of the USA-China (Figure 3), although the CCDF curves of cooperative scales between the USA and China were similar in 1992.01-2001.09, it should be noted that the curve of cooperative scales sent from the USA to China was above that from China to the USA in the range of 4 to 4.5 in Figure 3c. The similarity in 1992.01-2001.09 indicated that they took similar policy strategies toward each other when dealing with cooperation, the relative higher probability in 2001.10-2016.12 might be due to that the USA sought more from China, while China sought relatively less from the USA along with the increasingly extensive cooperation sent from the USA to China since 9/11 in 2001 (Li and Kong, 2010). The similar probability of conflictual scales between the USA and China in two periods suggested that they may take relative similar conflictual actions toward each other.

    The log-log plot of CCDF of the absolute cooperative and conflictual scales between the USA and China (Note: USA-CHN and CHN-USA mean the scales sent from the USA to China and those from China to the USA, respectively.)

    Figure 3.The log-log plot of CCDF of the absolute cooperative and conflictual scales between the USA and China (Note: USA-CHN and CHN-USA mean the scales sent from the USA to China and those from China to the USA, respectively.)

    In the USA-Russia dyad (Figure 4), similar probability in their cooperative behaviors between the USA and Russia was indicated by the approximately overlapping CCDF curves of cooperative scales shown in Figure 4a. At the same time, the difference was presented by the higher cooperative scales from the USA to Russia than those from Russia to the USA in the curves in the range of 4 to 5, as illustrated in Figure 4c. The conflictual behaviors of the USA-Russia dyads changed markedly and showed complicated characteristics. For one thing, the CCDF curves of conflictual scales from Russia to the USA were above the curve of the USA to Russia in the range of 2.5 to 3.5 in Figure 3b, while those from the USA to Russia were above in the range of 3.5 to 4.6 in Figure 3d. For another thing, the conflict sent from the USA toward Russia had a slightly longer tail, while those sent from Russia to the USA changed to have a longer tail, indicating that Russia changed to take a more unyielding attitude when dealing with intense conflict.

    The log-log plot of CCDF of the absolute cooperative and conflictual scales between the USA and Russia (Note: USA-RUS and RUS-USA mean the scales sent from the USA to Russia and those from Russia to the USA, respectively.)

    Figure 4.The log-log plot of CCDF of the absolute cooperative and conflictual scales between the USA and Russia (Note: USA-RUS and RUS-USA mean the scales sent from the USA to Russia and those from Russia to the USA, respectively.)

    In the dyad of Russia-China, the CCDF curves of cooperative scales were similar in Figures 5a and 5c, suggesting that a similar probability of cooperative behaviors of Russia and China toward each other in both periods. While the CCDF curves of conflictual scales from Russia to China were both higher than those from China to Russia in the ranges of 1.5 to 3 and 2 to 4 in Figures 5b and 5d, and had higher scales of conflict as illustrated by the long tail in Figures 5b and 5d. Those differences indicated that the conflictual behaviors of sent from Russia toward China were stronger than those from China toward Russia. Thus, it was interesting to see that Russia had been consistently giving China a hard time when dealing with conflict in both periods.

    The log-log plot of CCDF of the absolute cooperative and conflictual scales between Russia and China (Note: RUS-CHN and CHN-RUS mean the scales sent from Russia to China and those from China to Russia, respectively.)

    Figure 5.The log-log plot of CCDF of the absolute cooperative and conflictual scales between Russia and China (Note: RUS-CHN and CHN-RUS mean the scales sent from Russia to China and those from China to Russia, respectively.)

    3.3 Interdependence of cooperative and conflictual interactions

    This section would examine and discuss the interdependence of cooperative and conflictual interactions between the three dyads based on the results of VAR models. The significance level of the coefficients of the VAR models listed in Tables 2-4 illustrates how different inferences of the causality of the interactions. The notations of ***, **, and * indicate that the variables are significant at the statistical level of 5%, 10%, and 20%, respectively. According to the suggestion of Moore (1995) and Kang and Reuveny (2001), we set the significance level that 10% posits between 5% and 20%. Given the space limitations, the following analysis mainly focuses on the significant variables and summarizes the results.

    From the significance level of the Granger/Wald test in Table 2, we observed that the cooperation between the USA-China dyad changed from being Granger caused by the cooperative interactions between Russia-China dyad (see the significance level of 0.007 and 0.019 of RCp(-1), and 0.007 and 0.018 of CRp(-1) in the 2nd and 3rd columns) to be Granger caused by the cooperation between USA-Russia dyad (see 0.052 and 0.033 of URp(-1), and 0.156 and 0.146 of RUp(-1) in the 6th and 7th columns), the conflict taken from the USA toward China (see 0.027 and 0.031 of UCf(-1) in the 6th and 7th columns), as well as the conflict sent from Russia to China (see 0.127 and 0.055 of RCf(-1) in the 6th and 7th column). Thus, we concluded that the cooperative interactions between the USA and China were always Granger caused by Russian behaviors toward the other two countries. The conflictual behaviors sent from the USA toward China were Granger caused by the cooperative and conflictual behaviors from itself to Russia in two periods (see 0.161 and 0.054 of URp(-1), 0.146 and 0.083 of URf(-1) in the 4th and 8th columns). The conflictual behaviors sent from China to the USA were always Granger caused by the conflict sent from the USA to Russia, as well as the reciprocal conflict sent from the USA to China. However, they changed to become no longer Granger caused by the cooperation between Russia and China (see the significance level of RCp(-1) and CRp(-1) in the 5th and last columns). The conflict between the USA-China dyad indicated that the conflict sent from the USA to Russia always affected the conflictual actions taken from the USA to China.

    Independent variables1992.01-2001.09 period2001.10-2016.12 period
    Dependent variableDependent variable
    UCpCUpUCfCUfUCpCUpUCfCUf
    UCp(-1)-0.038***0.091**0.159*-0.7670.6810.615
    CUp(-1)0.649-0.090**0.3890.572-0.3060.234
    URp(-1)0.2960.4600.161*0.5430.052**0.033***0.054**0.571
    RUp(-1)0.2640.3830.2080.8490.156*0.146*0.2240.633
    RCp(-1)0.007***0.019***0.3280.024***0.4440.3420.5030.619
    CRp(-1)0.007***0.018***0.3820.018***0.4320.3310.3190.646
    UCf(-1)0.8660.754-0.149*0.027***0.031*-0.010***
    CUf(-1)0.2950.5370.042***-0.7600.6980.269-
    URf(-1)0.143*0.2100.146*0.012***0.8330.8360.083**0.078**
    RUf(-1)0.8720.8730.9330.8670.8560.9790.101*0.550
    RCf(-1)0.2230.4850.3570.8800.127*0.055**0.2830.671
    CRf(-1)0.4730.5610.4960.6690.5570.2530.8290.731
    R20.7260.7130.5580.5700.8920.8970.9120.914
    Adjusted R20.6940.6800.5060.5190.8840.8900.9050.908
    F-statistic22.74121.32010.82611.356115.926122.708145.113149.057

    Table 2.

    The significance level of the Granger/Wald test of the USA-China dyad in both periods

    From the significance level of the USA-Russia dyad in Table 3, we observed that the cooperation taken from the USA toward Russia was only Granger caused by those from Russia toward the USA in 1992.01-2001.09 period (see 0.112 with the notation of * in the 2nd column). In contrast, the cooperation taken from Russia toward the USA were only Granger caused by the cooperation sent from China to Russia (see 0.166 with the notation of * in the 3rd column). However, the conflictual actions taken from the USA toward China and Russia in 2001.10-2016.12 period both Granger caused the cooperation between the USA and Russia (see the significance level of 0.057 and 0.049 of UCf(-1), as well as 0.123 and 0.159 of URf(-1) in the 6th and 7th columns). At the same time, it was interesting to see that the cooperation sent from China to the USA changed to both Granger caused the cooperation between the USA and Russia (see the significance level of 0.055 and 0.032 of CUp(-1) in the 6th and 7th columns), indicating that China’s behaviors became to affect their both cooperative actions toward each other. Turning to the conflict between the USA and Russia, we found that none of the variables (including the only significant variable of RUp(-1) in the 5th column) was significant and Granger caused the conflictual behaviors from the USA toward Russia in the second period, suggesting that the reciprocal actions taken from Russia toward the USA did not help to predict the actions taken from the USA toward Russia when faced with conflict. It was more difficult to predict the conflictual behaviors sent from the USA toward Russia. However, the conflict sent from Russia toward the USA was always Granger caused by the actions taken from the USA toward Russia (see the significance level of 0.123 of URp(-1) in the 5th column and 0.003 of URf(-1) in the last column). The conflict between the USA and Russia was never Granger caused by China’s behaviors toward the two countries in both periods (the variables related to China’s behaviors were not highlighted by the notations in the 4th and 5th and 8th and 9th columns). These results indicated that China only played a limited role in their interactions between the USA and Russia.

    Independent variables1992.01-2001.09 period2001.10-2016.12 period
    Dependent variableDependent variable
    URpRUpURfRUfURpRUpURfRUf
    UCp(-1)0.7590.6420.4310.190*0.0970.060**0.6780.720
    CUp(-1)0.8420.7190.5680.2730.055**0.032***0.6420.840
    URp(-1)-0.5790.3040.123*-0.8270.7620.900
    RUp(-1)0.112*-0.163*0.113*0.856-0.8050.766
    RCp(-1)0.5180.3880.5040.7530.9300.8620.8870.916
    CRp(-1)0.2500.166*0.3380.5350.9440.8780.9270.938
    UCf(-1)0.8320.7700.6560.9190.057**0.049***0.3080.208
    CUf(-1)0.6510.3870.7960.8780.9370.7200.4600.644
    URf(-1)0.3910.626-0.3320.123*0.159*-0.003***
    RUf(-1)0.8630.5590.511-0.4300.2870.787-
    RCf(-1)0.9690.9580.7230.5850.4160.4700.3460.675
    CRf(-1)0.9780.9410.5420.6050.6040.4280.8860.535
    R20.5530.5400.5970.6040.8690.8690.8800.849
    Adjusted R20.5010.4860.5500.5580.8600.8600.8720.839
    F-statistic10.62810.07512.70713.09393.76993.501103.57279.374

    Table 3.

    The significance level of the Granger/Wald test of the USA-Russia dyad in both periods

    In the dyad of Russia and China as shown in Table 4, Russia-China cooperation changed from being both Granger caused by the conflict between the USA and China (see the significance level of UCf(-1) and CUf(-1) in the 2nd and 3rd columns), and the conflict between Russia and China in 1991.01-2001.09 period (see the significance level of RCf(-1) and CRf(-1) in the 2nd and 3rd columns), to being Granger caused by the cooperation and conflict sent from the USA to Russia (see the figures with notations of URp(-1) and URf(-1) in the 6th and 7th columns), as well as the cooperation sent from Russia to the USA in 2001.10-2016.12 period (see the figures with notations of RUp(-1) in the 6th and 7th columns). The conflict between Russia and China was always Granger caused by the conflict sent from the USA to Russia in both periods (see 0.131 and 0.048 of URf(-1) in the 4th and 5th columns, as well as 0.028 and 0.195 in the last two columns). Thus, the results illustrated that the behaviors sent from the USA to the other two (especially the conflictual behaviors from the USA to Russia) always Granger caused the cooperation and conflict between Russia-China dyad, suggesting that the actions taken from the USA toward Russia always played an essential role in affecting the interactions between Russia and China.

    Generally, there were three-quarters of the 12 cooperative variables (dependent variables), which were Granger caused by conflictual variables, and 7 of 12 conflictual variables (dependent variables), which were Granger caused by cooperative variables. This result supported our specification that incorporating the cooperative and conflictual variables into the VAR models, and suggesting the interdependence between the cooperative behaviors and the conflictual behaviors between the three dyads.

    Independent variables1992.01-2001.09 period2001.10-2016.12 period
    Dependent variableDependent variable
    RCpCRpRCfCRfRCpCRpRCfCRf
    UCp(-1)0.9190.7950.9500.5530.4450.4460.6130.339
    CUp(-1)0.6730.8070.6260.7280.2360.2630.8560.538
    URp(-1)0.6270.5020.5980.0910.011***0.011***0.3120.172*
    RUp(-1)0.7320.6810.9140.044***0.007***0.009***0.2770.163*
    RCp(-1)-0.6010.9110.119*-0.8450.7450.799
    CRp(-1)0.480-0.9710.4150.696-0.8510.603
    UCf(-1)0.006***0.001***0.9730.6080.5140.6610.5810.777
    CUf(-1)0.004***0.001***0.6140.6020.3030.3980.3590.195*
    URf(-1)0.9650.4530.131*0.048***0.062**0.153*0.028***0.195*
    RUf(-1)0.7450.6700.187*0.9050.5660.8330.181*0.360
    RCf(-1)0.000***0.000***-0.8870.2720.214-0.198*
    CRf(-1)0.001***0.000***0.054**-0.184*0.2020.917-
    R20.5390.5610.4440.4540.6920.6840.6820.695
    Adj. R20.4850.5090.3790.3910.6700.6620.6590.673
    F-statistic10.02410.9476.8457.14531.61630.52430.18032.109

    Table 4.

    The significance level of the Granger/Wald test of China-Russia dyad in both periods

    4 Discussion and conclusions

    This analysis used cooperative and conflictual scales of event data from GDELT and statistical methods to quantitatively investigate the interactions between the USA, Russia and China after the end of the Cold War. We analyzed the variations in the frequencies and intensities of their cooperative and conflictual interactions, differences in the degree of their cooperative and conflictual behaviors using the CCDF technique, as well as the interdependence of their cooperative and conflictual behaviors using the VAR model between the three dyads. Our results provided quantitative insights into the direct interactions between the three dyads and helps us to understand their interactions better in the post-Cold War period. The results are as follows.

    The frequencies and strengths of the USA-Russia interactions ranked first in the first period, while the interactions between the USA-China became the dominant interactions in the second period. The Russia-China interactions always occupied the third place. In the two periods, cooperation prevailed in the three dyads, but the conflictual interactions in the dyads of the USA-Russia and the USA-China were strong, especially the conflictual interactions between the USA and Russia tended to more intense in the second period, mainly related to their strategic contradiction in Georgia, Ukraine and Syria.

    The USA and China took similar cooperative actions toward each other suggested by a similar pattern of CCDF curves in the first period, while the USA had a relatively higher probability of sending cooperative behaviors to China due to the increasingly extensive cooperation sent from the USA to China since 9/11 in 2001. The USA and China may take similar actions toward each other in both periods when dealing with conflict, indicated by a similar CCDF pattern of conflictual scales. The USA and Russia, as well as Russia and China, both took similar cooperative behaviors toward each other, as indicated by the approximately overlapping CCDF curves of cooperative scales between the two dyads. However, there were differences in conflictual behaviors toward each other in the two dyads: the conflictual behaviors in the USA-Russia dyads showed complicated characteristic, and Russia had been consistently giving China a hard time in both periods when dealing with conflict.

    The VAR results suggested the interdependence between cooperative and the conflictual behaviors in the three dyads, as shown that three-quarters of the 12 cooperative variables (dependent variables) were Granger caused by conflictual variables, and 7 of 12 conflitual variables (dependent variables) were Granger caused by cooperative variables. In the three dyads, Russia’s behaviors toward the two countries always Granger caused their cooperative interactions between the USA and China, and the conflict sent from the USA to Russia always Granger caused its conflictual behaviors to China. The VAR results indicated that China played a limited role in the interactions of the USA-Russia for that the behaviors of China only Granger caused the cooperation between the USA and Russia, but it had never been the Granger cause of their conflictual interactions in both periods. These results quantitatively supported the asymmetrical interdependent interaction patterns between the USA and China, the USA and Russia, as well as Russia and China.

    The main objective of our analysis is to investigate the directly cooperative and conflictual interactions between the three dyads from the time-series perspective since the end of the Cold War. Therefore, as for understanding what factors affect the interactions between the three dyads, we would briefly discuss the potential factors, including military strength, economic strength, economic independence (especially trade independence), geopolitical factors and others (Gladkyy, 2003; Qi, 2012). The military strength works as the safeguarded of national security, the unbalanced military strength and strategic deployment affect their cooperative and conflictual behaviors toward each other. Despite that the three countries all have nuclear weapons, the USA is still the most powerful and deterrent country in military strength and strategic deployment. Generally, the gap of economic strength between dyad countries lessens, it is likely to occur power transfer and lead to bilateral conflict (Qi, 2012). The GDP ratio of the USA to China shrunk from 15.6 in 1992 to 1.63 in 2016. Thus, it was likely to lead to conflict sent from the USA to China for the shrinking GDP gap and China’s rising. The GDP ratio of Russia to China had gradually increased from 0.9 in 1992 to 9 in 2016. The GDP ratio of Russia to the USA slightly increased from 14.2 to 14.6 from 1992 to 2016. Although their GDP gap did not expand, the geopolitical conflicts between the USA and Russia over the Middle East regions (especially in Iran, Syria) and Ukraine were intense in recent years, both illustrated by Figure 2 and Liu (2017) . The geopolitical factors affecting the interactions between the USA-China dyad mainly lie in the contradictions over DPRK and Taiwan, China, and those between Russia-China dyad focus on DPRK, respectively. It is generally to believe that higher trade interdependence leads to promote bilateral cooperation, and less trade interdependence tends to cause poor relations between the two sides (Qi, 2012). However, the recent high tariffs on Chinese imports sent from the USA illustrated that a considerable amount of trade deficit (-347 billion dollars in 2016) from the USA to China would trigger conflict. Additionally, the difference in ideology (Qi, 2012) and national leadership would also affect their cooperative and conflictual behaviors toward each other.

    Besides these results, we also would like to discuss how the GDELT event data is used in quantifying the behaviors and interactions between countries and help to provide references for researchers. In the existing studies, event data from GDELT to measure the interactions between dyads is used in four ways: (1) temporally aggregated net scales of events (Li, 2015); (2) temporally aggregated averaged scales of events (Abb and Strüver, 2015; Pang and Liu, 2019); (3) temporally ratio of cooperative scales to conflictual scales (Chi and Hou, 2019; Liu et al., 2019), and (4) separate temporally aggregated scales of events for cooperation and conflict (Chen et al., 2019; Shen et al., 2019). Methods (1) and (2) give rise to problems (Yonamine, 2013). For example, if the scale of cooperation between two countries in one month is 8.3 and the score of conflict is -8.3, thus the net scale and the averaged scale of this month are both zero; if there are no events in the next month, however, the net scale and the averaged scale also both equal zero, despite disparities in interactions over the two months. The ratio of cooperative scales to conflictual scales of method (3) can eliminate substantial differences in the number of events in different years but cannot reflect the intensity of the interactions in the given period. Method (4) is a more logical and appropriate method than the other three. Hence, we chose this way to conduct our analysis. Our results indicated mutual causality between the cooperative and the conflict behaviors. However, the existing studies that used methods (1) and (2), i.e., the net scale or the averaged scale of event data between dyad countries, could not find such interdependence between cooperative and conflictual behaviors.

    Some limitations are to be illustrated. How other countries affect the interactions between the three countries from the international political network was not provided. In the future, we will attempt to investigate other countries’ impacts on the three countries’ interactions using the social network method. GDELT database also provides coordinate information (i.e., latitude and longitude) for events and thus make it possible to utilize methods of spatial analysis to investigate the spatial distribution and dynamics of the different types of interactions between the three countries, and identify “hot” locations with intense conflicts to enhance understanding about the spatial pattern of the geopolitical conflicts. GDELT data with coordinate information provides geographers with the potential to investigate questions related to geopolitics and political geography proposed by several domestic scholars (Du et al., 2016; Ge et al., 2018; Liu et al., 2018; Song et al., 2018), for instance, investigating, evaluating and even forecasting local or global geopolitical risks spatially. GDELT data deserves further exploration to extend its application for geopolitics and political geography, as well as other fields in geography.

    Declaration

    The views of this paper do not represent the views of the project.

    Acknowledgement

    We would like to thank the high-performance computing support from the Center for Geodata and Analysis, Faculty of Geographical Science, Beijing Normal University [https://gda. bnu.edu.cn/], as well as the support from the Global News Event Data Platform at Center for Geodata and Analysis, Faculty of Geographical Science, Beijing Normal University.

    References

    [1] AbbP, StrüverG. Regional linkages and global policy alignment: The case of China-Southeast Asia relations. In: German Institute of Global and Area Studies(2015).

    [2] Azar EE. The Conflict and Peace Data Bank (COPDAB) Project. Journal of Conflict Resolution, 24, 143-152(1980).

    [3] Bodas-Sagi DJ, Labeaga JM. Using GDELT data to evaluate the confidence on the Spanish government energy policy. International Journal of Interactive Multimedia and Artificial Intelligence, 3, 38-43(2016).

    [4] ChenXiaoqiang, YuanLihua, ShenShi et al. The analysis of geo-relationships among China and its neighboring countries. Acta Geographica Sinica, 74, 1534-1547(2019).

    [5] ChiZhipei, HouNa. Quantitative research on big data and bilateral relations: A case study of GDELT and Sino-US relations. Quarterly Journal of International Politics, 4, 67-88(2019).

    [6] CukierK, Mayer-SchoenbergerV. The rise of big data: How it’s changing the way we think about the world. Foreign Affairs, 92, 28-41(2013).

    [7] Dickey DA, Fuller WA. Distribution of the estimators for autoregressive time series with a unit root. Journal of the American statistical Association, 74, 427-431(1979).

    [8] Dickey DA, Fuller WA. Likelihood ratio statistics for autoregressive time series with a unit root. Econometrica, 49, 1057-1072(1981).

    [9] Dixon WJ. Reciprocity in United States-Soviet relations: Multiple symmetry or issue linkage?. American Journal of Political Science, 30, 421-445(1986).

    [10] DuDebin, DuanDezhong, LiuChengliang et al. Twenty-five years of progress in geopolitics research: Efforts from China's geographers. Journal of Geographical Sciences, 26, 1223-1242(2016).

    [11] ElshendyM, FronzettiC. Big data analysis of economic news: Hints to forecast macroeconomic indicators. International Journal of Engineering Business Management, 9, 1-12(2017).

    [12] Freeman JR, Williams JT, LinT. Vector autoregression and the study of politics. American Journal of Political Science, 33, 842-877(1989).

    [13] Gao JB, HuJ. Financial crisis, Omori’s law, and negative entropy flow. International Review of Financial Analysis, 33, 79-86(2014).

    [14] Gao JB, Leetaru KH, Hu J et al. Massive media event data analysis to assess world-wide political conflict and instability. In: Greenberg A M, Kennedy W G, Bos N D, 2013. Social Computing, Behavioral-Cultural Modeling and Prediction, 284-292(2013).

    [15] GeQuansheng, JiangDong, LuFeng et al. Spatio-temporal simulation of the geopolitical environment system. Journal of Geographical Sciences, 28, 871-880(2018).

    [16] GladkyyO. American foreign policy and US relations with Russia and China after 11 September. World Affairs, 166, 3-23(2003).

    [17] Goldstein JS. Reciprocity in superpower relations: An empirical analysis. International Studies Quarterly, 35, 195-209(1991).

    [18] Goldstein JS. A conflict-cooperation scale for WEIS events data. Journal of Conflict Resolution, 36, 369-385(1992).

    [19] Goldstein JS, Freeman JR. U.S.-Soviet-Chinese relations: Routine, reciprocity, or rational expectations?. American Political Science Review, 85, 17-35(1991).

    [20] Gonzalo D CS, GarcíaherreroA, OrtizA et al. An empirical assessment of social unrest dynamics and state response in Eurasian countries. Social Science Electronic Publishing, 3, 1-29(2015).

    [21] GuoZhenyuan. China-US-Russia relationship since September 11. Peace and Development, 1-5(2002).

    [22] Kalyvas SN, BalcellsL. International system and technologies of rebellion: How the end of the cold war shaped internal conflict. American Political Science Review, 104, 415-429(2010).

    [23] KangH, ReuvenyR. An exploration of multi-country political conflict/cooperation interdependence. International Interactions, 26, 129-152(2000).

    [24] KangH, ReuvenyR. Exploring multi-country dynamic relations between trade and conflict. Defence & Peace Economics, 12, 175-196(2001).

    [25] Kornberg JF. Chinese foreign policy: Theory and practice (review). China Review International, 3, 251-254(1996).

    [26] LazerD, PentlandA, AdamicL et al. Computational social science. Science, 323, 721-723(2014).

    [27] LeetaruK, Schrodt PA. GDELT: Global data on events, location, and tone, 1979-2012. In: The International Studies Association. Annual Conference of the International Studies Association. San Diego, California, March, 29, 2013(2013).

    [28] LevinN, AliS, CrandallD. Utilizing remote sensing and big data to quantify conflict intensity: The Arab Spring as a case study. Applied Geography, 94, 1-17(2018).

    [29] Li PW. The role of USA in Cross-Strait relations: A time series analysis approach. Soochow Journal Political Science., 33, 207-270(2015).

    [30] LiQingsi. The Sino-US-Russian relations in dynamic balance. Frontiers, 6-14(2017).

    [31] LiSaojun. Conflict-cooperation model: Quantitative analysis of Sino-US relations. World Economics and Politics, 43-49(2002).

    [32] LiXing, KongRui. Russian factors on Sino-US relationship. Russian, East European & Central Asian Studies, 60-68(2010).

    [33] LiuFenghua. Triangular relationship among China, Russia and the US after the Ukraine crisis: Adjustment and trend. International Economic Review, 103-115(2017).

    [34] LiuYi, WangYun, YangYu et al. Regional integration and interaction of the Guangdong-Hong Kong-Macao Greater Bay Area. Acta Geographica Sinica, 74, 2455-2466(2019).

    [35] LiuYungang, WangFenglong, AnNing. The duality of political geography in China: Integration and challenges. Geopolitics(2018).

    [36] LuM. Vector Autoregression (VAR): An approach to dynamic analysis of geographic processes. Geografiska Annaler. Series B, Human Geography, 83, 67-78(2001).

    [37] MaMenglan, FangPeng, Gao Jianbo et al. Does ideology affect the tone of international news coverage? In: 2017 International Conference on Behavioral, Economic, Socio-Cultural Computing (BESC)(2017).

    [38] MaMingqing, YuanWu, GeQuansheng et al. Big data analysis of social development situation in regions along the Belt and Road. Progress in Geography, 38, 1009-1020(2019).

    [39] McGinnis MD, Williams M GT. Change and stability in superpower rivalry. The American Political Science Review, 83, 1101-1123(1989).

    [40] Moore WH. Action-reaction or rational expectations? Reciprocity and the domestic-international conflict nexus during the "Rhodesia Problem". Journal of Conflict Resolution, 39, 129-167(1995).

    [41] PangXun, LiuZiye. China-U.S. in Massive Machine-coded event data: Influence of reciprocity, policy inertia, and a third power. World Economics and Politics, 53-79(2019).

    [42] QiHaixia. An analysis of the factors affecting China’s relations with the other major powers. Chinese Journal of European Studies, 61-78(2012).

    [43] RajmairaS, Ward R MD. Evolving foreign policy norms: Reciprocity in the superpower triad. International Studies Quarterly, 34, 457-475(1990).

    [44] ShenShi, SongChangqing, ChengChangxiu et al. GDELT: Big event data for sensing global social dynamics. World Regional Studies, 29, 71-76(2020).

    [45] ShenShi, YuanLihua, YeSijing et al. The fluctuation and background analysis of geopolitical relations between China and USA during the last 40 years. Scientia Geographica Sinica, 39, 1063-1071(2019).

    [46] SimsC. A comparison of interwar and postwar business cycles: Monetarism reconsidered. American Economic Review, 70, 250-257(1980).

    [47] SongChangqing, GeYuejing, LiuYungang et al. Under taking research on Belt and Road Initiative from the geo-relation perspective. Geographical Research, 37, 3-19(2018).

    [48] Theocharous AL, AnastasiosZ, NeophytosL et al. Tourism, instability and regional interdependency: Evidence from the Eastern-Mediterranean. Defence and Peace Economics, 31, 245-268(2018).

    [49] Ward MD. Cooperation and conflict in foreign policy behavior: Reaction and memory. International Studies Quarterly, 26, 87-126(1982).

    [50] Ward MD, RajmairaS. Reciprocity and norms in U.S.-Soviet foreign policy. Journal of Conflict Resolution, 36, 342-368(1992).

    [51] Weidmann NB. A closer look at reporting bias in conflict event data. American Journal of Political Science, 60, 206-218(2016).

    [52] YanXuetong. The instability of China-US relations. The Chinese Journal of International Politics, 3, 263-292(2010).

    [53] YanXuetong, QiHaixia. Football game rather than boxing match: China-US intensifying rivalry does not amount to Cold War. The Chinese Journal of International Politics, 5, 105-127(2012).

    [54] Yonamine JE. A nuanced study of political conflict using the Global Datasets of Events Location and Tone (GDELT) dataset. University Park, Pennsylvania: Doctoral Dissertation of Pennsylvania State University, University Park, 1-183(2013).

    [55] YuanYihong, LiuYu, WeiGuixing. Exploring inter-country connection in mass media: A case study of China. Computers Environment & Urban Systems, 62, 86-96(2017).

    [56] ZhangChuchu, XiaoCaowei, LiuHelin. Spatial big data analysis of political risks along the Belt and Road. Sustainability, 11(2019).

    [57] ZhaoHuasheng. Research on the New Triangular Relationship between China, Russia and the U.S. Russian, Central Asian & East European Studies, 5-29(2018).

    Lihua YUAN, Changqing SONG, Changxiu CHENG, Shi SHEN, Xiaoqiang CHEN, Yuanhui WANG. The cooperative and conflictual interactions between the United States, Russia, and China: A quantitative analysis of event data[J]. Journal of Geographical Sciences, 2020, 30(10): 1702
    Download Citation