Author Affiliations
School of Earth Science and Engineering, Hohai University, Nanjing 211100, Jiangsu, Chinashow less
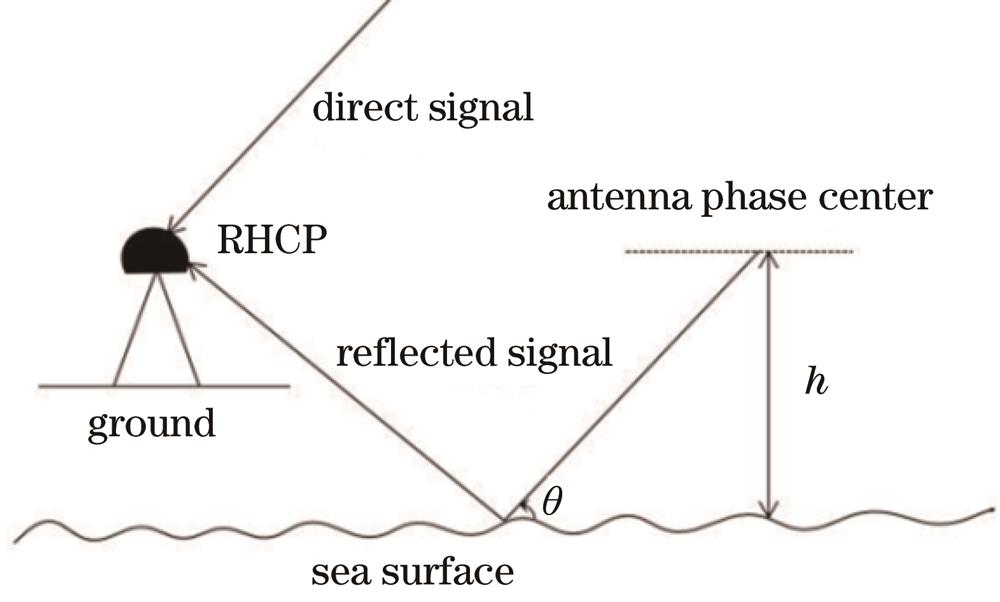
Fig. 1. GNSS-R inversion of tide surface height
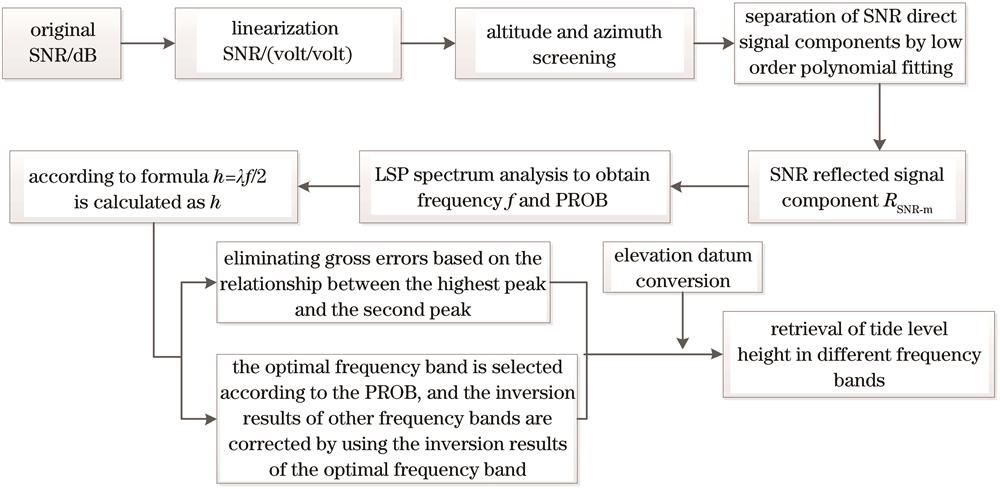
Fig. 2. Flow chart of tide level inversion from SNR
Fig. 3. Relationship between GPS inversion accuracy in different frequency bands and PROB. (a) GPS S1C; (b) GPS S2W; (c) GPS S1X; (d) GPS S5X
Fig. 4. GPS tide level inversion result using scheme 1
Fig. 5. GPS tide level inversion result using scheme 2
| Satellite system | Frequency band | Frequency /MHz | Channel /code | Type of SNR |
|---|
| L1 | 1575.420 | C/A | S1C | | GPS | L2 | 1227.600 | Z tracking and similar (AS on) | S2W | | L2C(M+L) | S2X | | BDS-3 | L3 | 1176.450 | I+Q | S5X | | B1 | 1561.098 | I | S1I | | B2 | 1207.140 | I | S7I | | B2a | 1176.450 | D+P | S5X | | B1C | 1575.420 | D+P | S1X | | B3 | 1268.520 | I | S6I |
|
Table 1. MAYG station GPS and BDS-3 satellite system data type
| Frequency band | DOY |
|---|
| 333 days | 334 days | 335 days | 336 days | 337 days | 5 days |
|---|
| GPS S2X | 0.5732 | 0.5436 | 0.5829 | 0.5008 | 0.4755 | 0.5373 | | GPS S5X | 0.5835 | 0.5760 | 0.5750 | 0.4741 | 0.4459 | 0.5348 | | BDS S5X | 0.5699 | 0.5759 | 0.5447 | 0.7937 | 0.7401 | 0.6512 |
|
Table 2. Inversion accuracy of GPS S2X, S5X, and BDS S5X
| Frequency band | Parameter | DOY | 5 days |
|---|
| 333 | 334 | 335 | 336 | 337 |
|---|
| GPS S1C | Number of tide level inversion results | 13 | 10 | 10 | 12 | 13 | 58 | | RMSE /m | 0.9330 | 1.0078 | 0.7564 | 1.0752 | 0.5612 | 0.8824 | | GPS S2W | Number of tide level inversion results | 23 | 19 | 21 | 24 | 23 | 110 | | RMSE /m | 0.8161 | 1.0837 | 0.6990 | 0.8347 | 0.6480 | 0.8217 | | BDS S1X | Number of tide level inversion results | 20 | 19 | 18 | 17 | 20 | 94 | | RMSE /m | 1.7340 | 1.5914 | 1.5013 | 1.6052 | 1.9647 | 1.6943 | | BDS S2I | Number of tide level inversion results | 33 | 27 | 30 | 29 | 31 | 150 | | RMSE /m | 0.7671 | 1.0451 | 0.9666 | 1.0393 | 1.1435 | 0.9960 | | BDS S6I | Number of tide level inversion results | 29 | 17 | 27 | 21 | 24 | 118 | | RMSE /m | 1.2424 | 1.4895 | 1.4975 | 1.4742 | 1.3968 | 1.4127 | | BDS S7I | Number of tide level inversion results | 28 | 17 | 20 | 17 | 23 | 105 | | RMSE /m | 1.5133 | 1.7255 | 1.4970 | 1.3976 | 1.4962 | 1.5252 |
|
Table 3. Statistics of inversion results of GPS S1C and S2W and BDS S1X, S2I, S6I, and S7I frequency band using scheme 1
| Frequency band | Number of tide level inversion results | RMSE /m |
|---|
| GPS S1C | 19 | 1.0108 | | GPS S2W | 60 | 0.7288 | | GPS S2X | 98 | 0.5410 | | GPS S5X | 98 | 0.5143 | | GPS | 275 | 0.6205 | | BDS S1X | 71 | 1.6384 | | BDS S2I | 52 | 0.9340 | | BDS S5X | 107 | 0.5618 | | BDS S6I | 42 | 1.3413 | | BDS S7I | 34 | 1.2940 | | BDS | 306 | 1.1465 |
|
Table 4. Statistical of 5-day inversion results using 9 frequency bands of BDS and GPS in scheme 2
| Frequency band | Parameter | DOY | 5 days |
|---|
| 333 | 334 | 335 | 336 | 337 |
|---|
| GPS S1C | Number of tide level inversion results | 30 | 32 | 31 | 31 | 31 | 155 | | RMSE /m | 0.6267 | 0.6599 | 0.7441 | 0.5843 | 0.6135 | 0.6482 | | GPS S2W | Number of tide level inversion results | 29 | 32 | 30 | 31 | 30 | 152 | | RMSE /m | 0.6842 | 0.7076 | 0.6433 | 0.5235 | 0.5921 | 0.6336 | | BDS S1X | Number of tide level inversion results | 28 | 30 | 30 | 29 | 29 | 146 | | RMSE /m | 0.7394 | 0.6926 | 0.5184 | 0.6711 | 0.6362 | 0.6546 | | BDS S2I | Number of tide level inversion results | 49 | 48 | 51 | 52 | 54 | 254 | | RMSE /m | 0.7526 | 0.5366 | 0.6235 | 0.7656 | 0.5627 | 0.6550 | | BDS S6I | Number of tide level inversion results | 49 | 49 | 52 | 49 | 54 | 253 | | RMSE /m | 0.7482 | 0.5995 | 0.7720 | 0.7442 | 0.8056 | 0.7391 | | BDS S7I | Number of tide level inversion results | 49 | 48 | 51 | 49 | 53 | 250 | | RMSE /m | 0.7922 | 0.5765 | 0.5556 | 0.7489 | 0.6983 | 0.6805 |
|
Table 5. Statistics of inversion results of GPS S1C and S2W and BDS S1X, S2I, S6I, and S7I frequency band using scheme 3