
Jian-Yin Zhou, Jie Xiang, Si-Xun Huang. New method of determining height of atmospheric boundary layer and numerical experiment [J]. Acta Physica Sinica, 2020, 69(9): 090201-1
- Acta Physica Sinica
- Vol. 69, Issue 9, 090201-1 (2020)
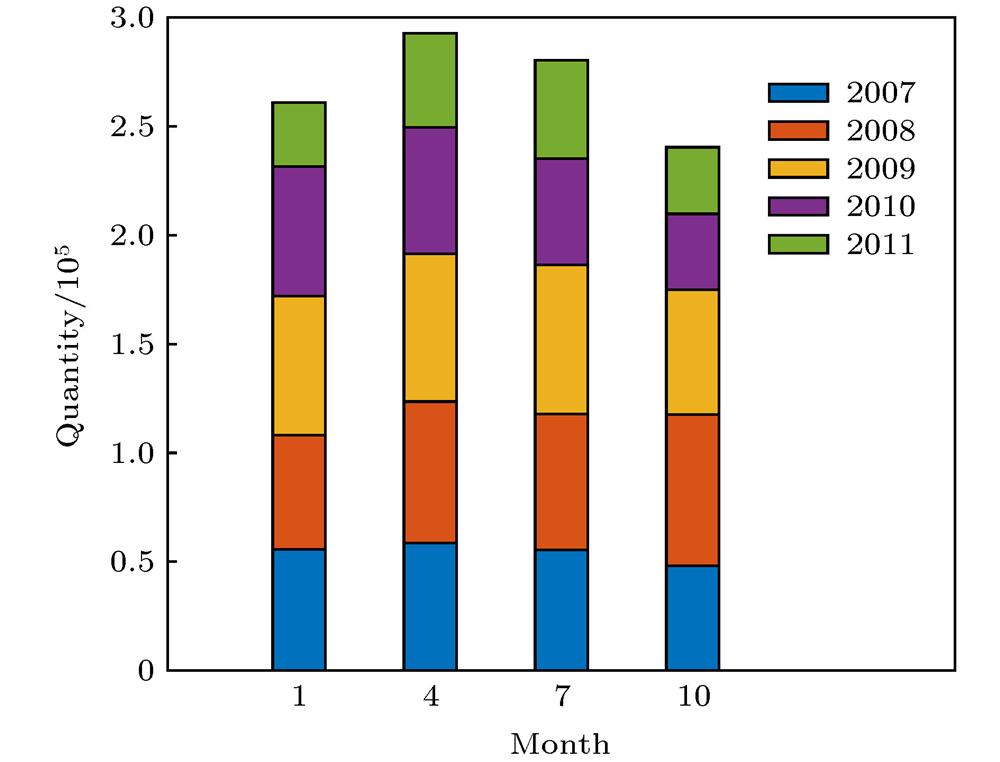
Fig. 1. Temporal distribution of the number of occultation profiles in January, April, July and October, 2007−2011.
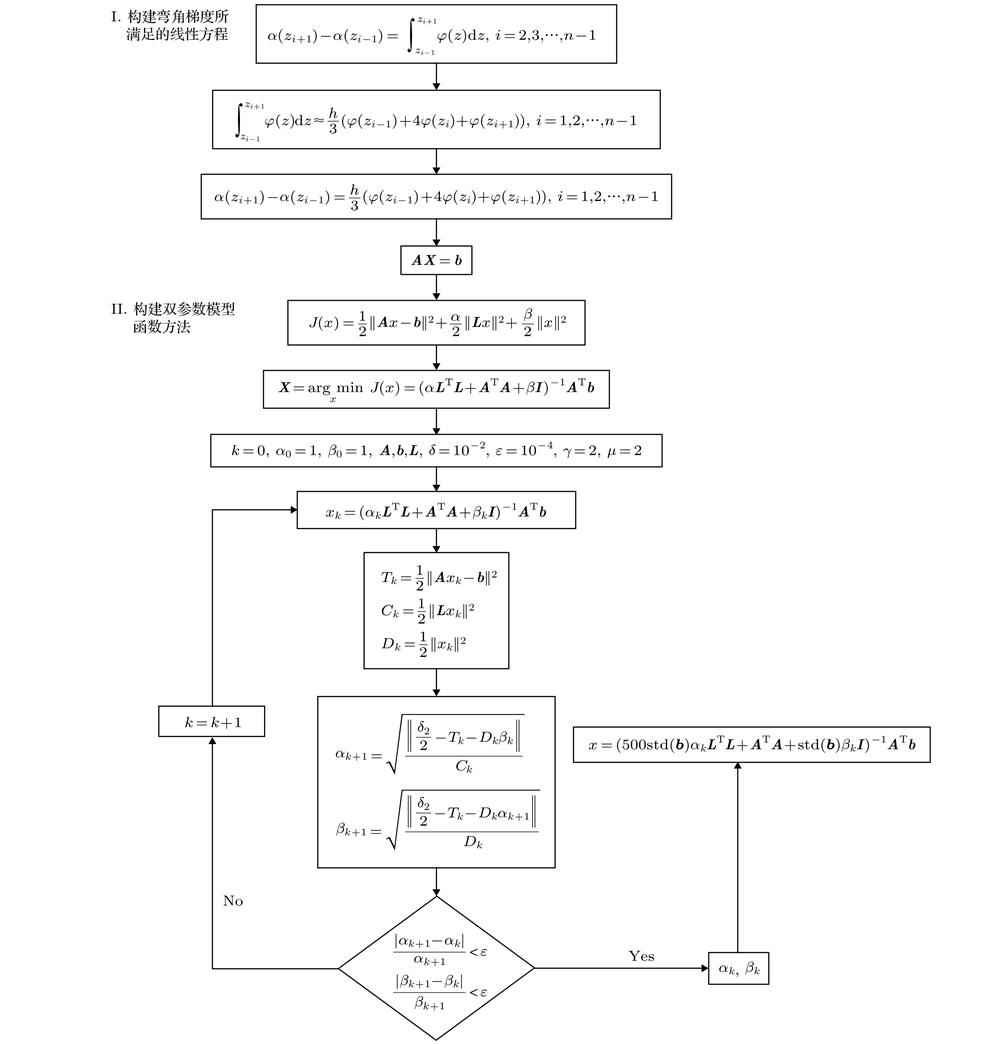
Fig. 2. Flow chart of two-parameter model function method.
Fig. 3. Angle gradient profile obtained by the difference method and the model function method using the bending angle gradient profile (BA represents the bending angle): (a) Bending angle profile with uniform random error
 , boundary layer top height
 ; (b) bending angle profile with uniform random error
 , boundary layer top height
 ; (c) bending angle profile with uniform random error
 , boundary layer top height
 ; (d) bending angle profile with uniform random error
 , boundary layer top height
 .
.
, boundary layer top height
; (b) bending angle profile with uniform random error
, boundary layer top height
; (c) bending angle profile with uniform random error
, boundary layer top height
; (d) bending angle profile with uniform random error
, boundary layer top height
. Fig. 4. Height of the boundary layer obtained by the three methods: (a) Three methods to get the height of the boundary layer top based on profile 1, H true = 3.15 km, std(H M) = 0.013, std(H L) = 0.44, std(H M) = 0.61; (b) three methods to get the height of the boundary layer top based on profile 2, H true = 4.55 km, std(H M) = 0.020, std(H L) = 0.89, std(H M) = 1.19
Fig. 5. The 5-year average boundary layer height of the ocean obtained by the model function method, the data used is the bending angle profile of the four months of 2007−2011 in January, April, July, and October: (a) The average height of the boundary layer in January; (b) the average height of the boundary layer in April; (c) the average height of the boundary layer in July; (d) the average height of the boundary layer in October.
Fig. 6. The 5-year average boundary layer height of the ocean obtained by the model function method, the data used is the zbalmax provided by CDAAC of the four months of 2007−2011 in January, April, July, and October: (a) The average height of the boundary layer in January; (b) the average height of the boundary layer in April; (c) the average height of the boundary layer in July; (d) the average height of the boundary layer in October.

Set citation alerts for the article
Please enter your email address
© Copyright 2018-2021 | Chinese Laser Press. All Rights Reserved 沪ICP备15018463号-20