
Haoyu Wang, Jun Zheng, Yifei Fu, Chengliang Wang, Xinran Huang, Zhicheng Ye, Liejia Qian. Multichannel high extinction ratio polarized beam splitters based on metasurfaces[J]. Chinese Optics Letters, 2019, 17(5): 052303
- Chinese Optics Letters
- Vol. 17, Issue 5, 052303 (2019)
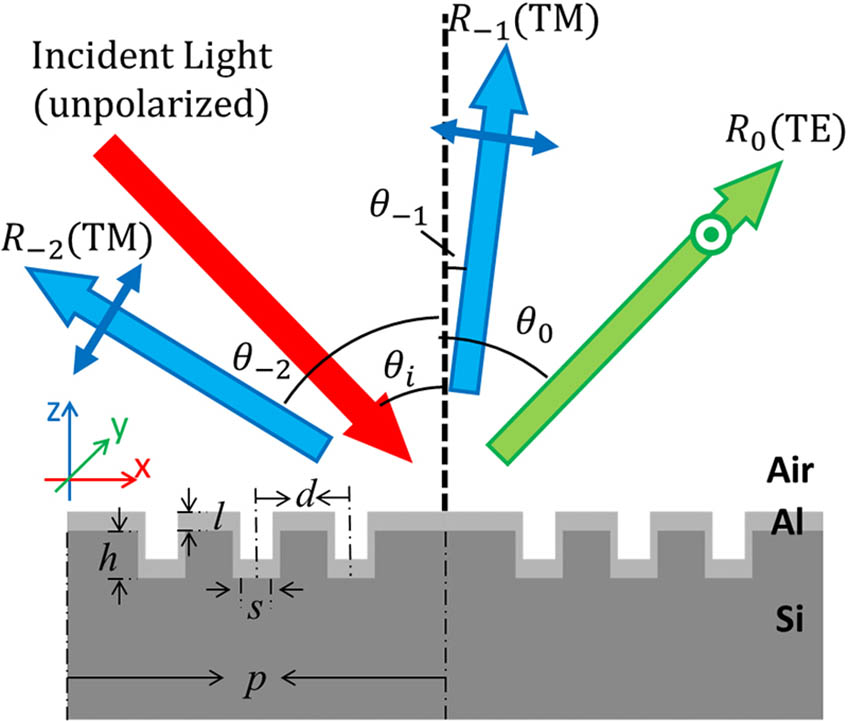
Fig. 1. Schematic drawings of PBSs based on metasurfaces. Unpolarized light (red arrow) is incident on the structure with an angle of
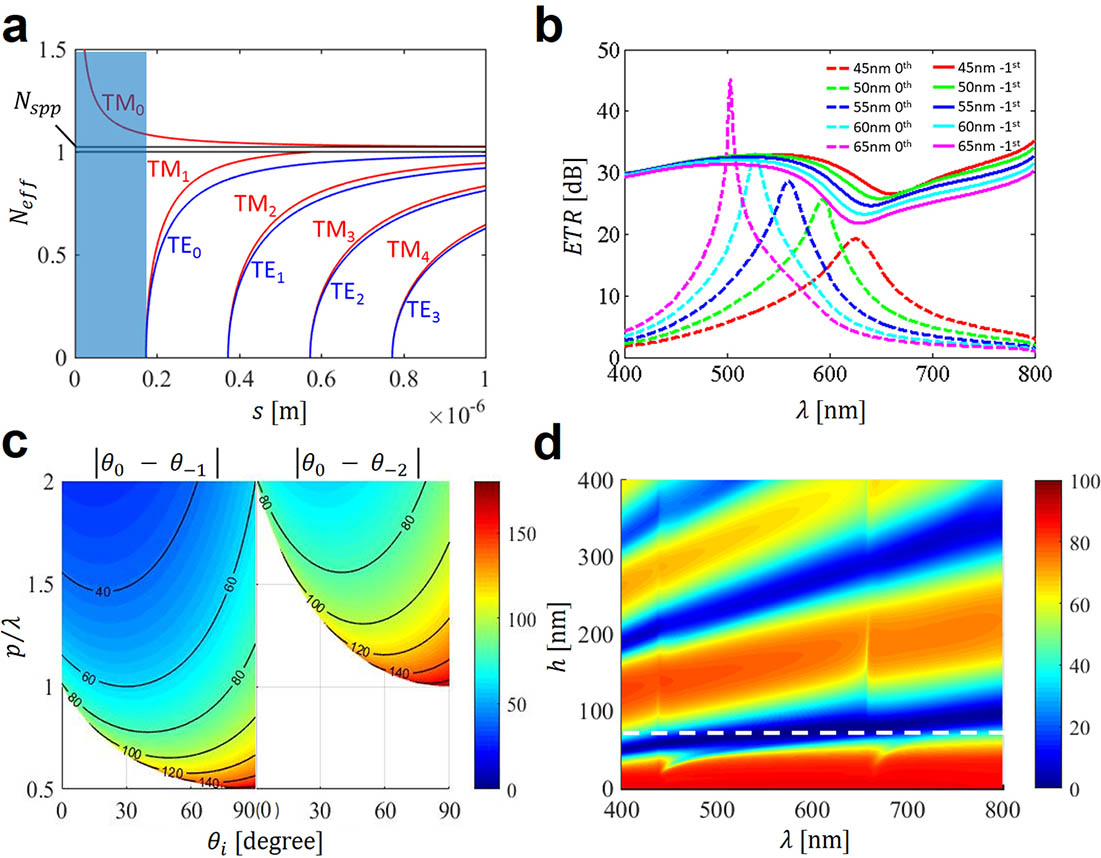
Fig. 2. Numerical simulation of the structure. a, The mode effective refractive index
Fig. 3. Simulated reflections and diffractions for one-slit and three-slit MNGs with a pitch of 800 nm under incident angle
Fig. 4. Simulated spectra of ETRs for one-slit and three-slit structures. a,
Fig. 5. SEM images and measured spectra dependent on incident angle for the 800 nm pitch structure. a, Top view and, b, side view of the fabricated sample. c, Measured reflected, cI, TE and, cII, TM spectra and, cIII,
Fig. 6. SEM images and measured spectra dependent on incident angle for the 600 nm pitch structure. a, Top view and, b, side view of the fabricated sample. c, Measured reflected, cI, TE and, cII, TM spectra and, cIII,

Set citation alerts for the article
Please enter your email address
© Copyright 2018-2021 | Chinese Laser Press. All Rights Reserved 沪ICP备15018463号-20