
Jiaqi Yin, Shiyong Wang, Fanming Li. Division-of-Focal-Plane Polarization Image Denoising Algorithm Based on Improved Principal Component Analysis[J]. Acta Optica Sinica, 2021, 41(7): 0710002
- Acta Optica Sinica
- Vol. 41, Issue 7, 0710002 (2021)
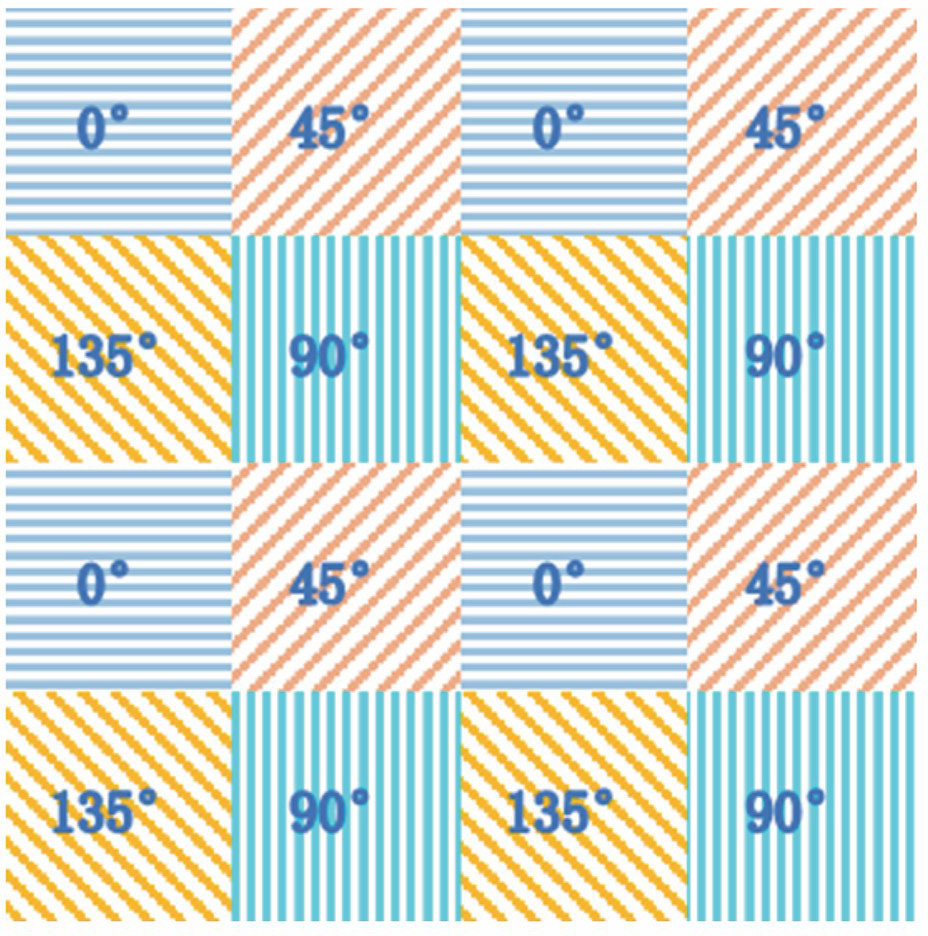
Fig. 1. Schematic diagram of the micro-polarizer array
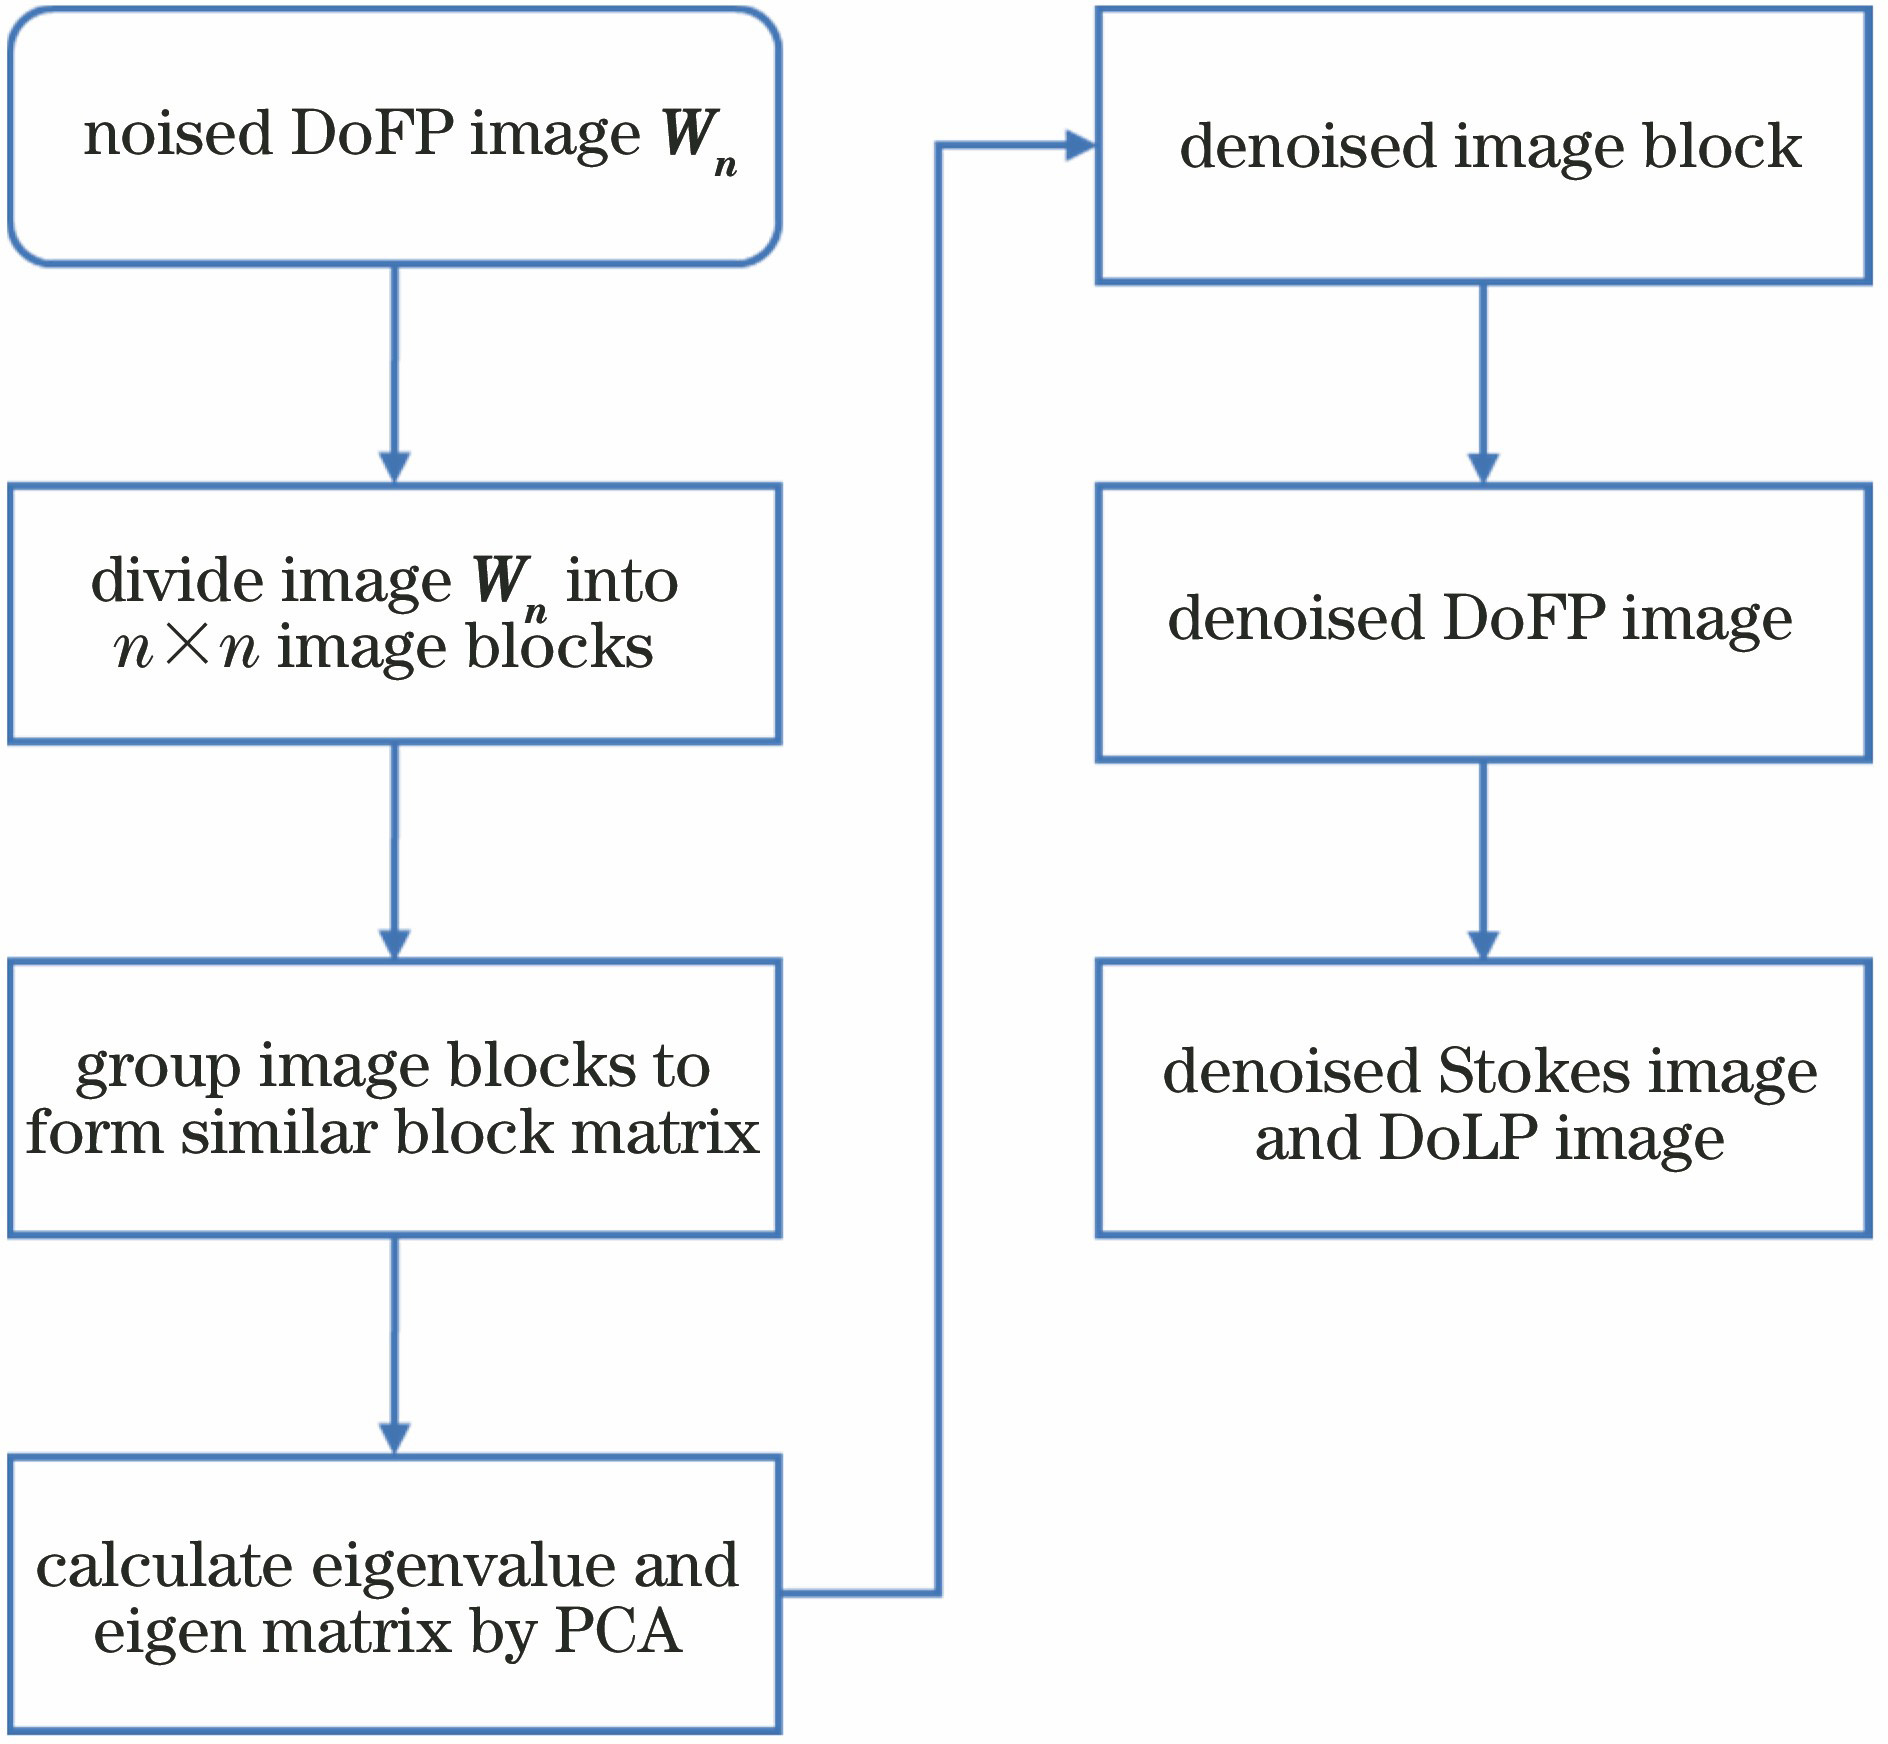
Fig. 2. Flow chart of our algorithm
Fig. 3. Denoising model of the DoFP polarization image
Fig. 4. DoFP polarization image obtained by simulation. (a) DoFP; (b) 0°; (c) 45°; (d) 90°; (e) 135°
Fig. 5. Test images. (a) Fabrics; (b) leaves; (c) macbeth classic; (d) macbeth enhancement; (e) painting; (f) potery
Fig. 6. Potery images before and after denoising. (a) Original image; (b) demosaicing image; (c) noisy image; (d) denoised image
Fig. 7. Denoising results under different σ. (a) PSNR; (b) SSIM
Fig. 8. Denoising results of different algorithms. (a) Original image; (b) demosaicing image; (c) noisy image; (d) PCA algorithm; (e) K-SVD algorithm; (f) BM3D algorithm; (g) our algorithm
Fig. 9. Denoising results of different algorithms for image macbeth enhancement. (a) PSNR; (b) SSIM
Fig. 10. Denoising result of real images by different algorithms. (a) Original image; (b) non-uniformity corrected image; (c) PCA algorithm; (d) K-SVD algorithm; (e) BM3D algorithm; (f) our algorithm
| ||||||||||||||||||||||||||||||||||||||||||
Table 1. Stokes vector images and DoLP images before and after denoising
|
Table 2. Average running time of different algorithms
| ||||||||||||||||||||||||||||||||||||||||||||||||||||||||||||||||||||||||||||||||||||||||
Table 3. Denoising results of different algorithms
| ||||||||||||||||||||||||||||||||||||||||||||||||||||||||||||||||||||||||||||||
Table 4. Denoising results of different algorithms on macbeth enhancement images

Set citation alerts for the article
Please enter your email address
© Copyright 2018-2021 | Chinese Laser Press. All Rights Reserved 沪ICP备15018463号-20