• Chinese Optics Letters
  • Vol. 19, Issue 5, 051701 (2021)
Ying Li1, Jianglei Di1、*, Li Ren2, and Jianlin Zhao1、**
Author Affiliations
  • 1MOE Key Laboratory of Material Physics and Chemistry under Extraordinary Conditions, and Shaanxi Key Laboratory of Optical Information Technology, School of Physical Science and Technology, Northwestern Polytechnical University, Xi’an 710129, China
  • 2School of Life Sciences, Northwestern Polytechnical University, Xi’an 710072, China
  • show less
    DOI: 10.3788/COL202119.051701 Cite this Article Set citation alerts
    Ying Li, Jianglei Di, Li Ren, Jianlin Zhao. Deep-learning-based prediction of living cells mitosis via quantitative phase microscopy[J]. Chinese Optics Letters, 2021, 19(5): 051701 Copy Citation Text show less
    Flowchart of algorithm for QPM based on the TIE.
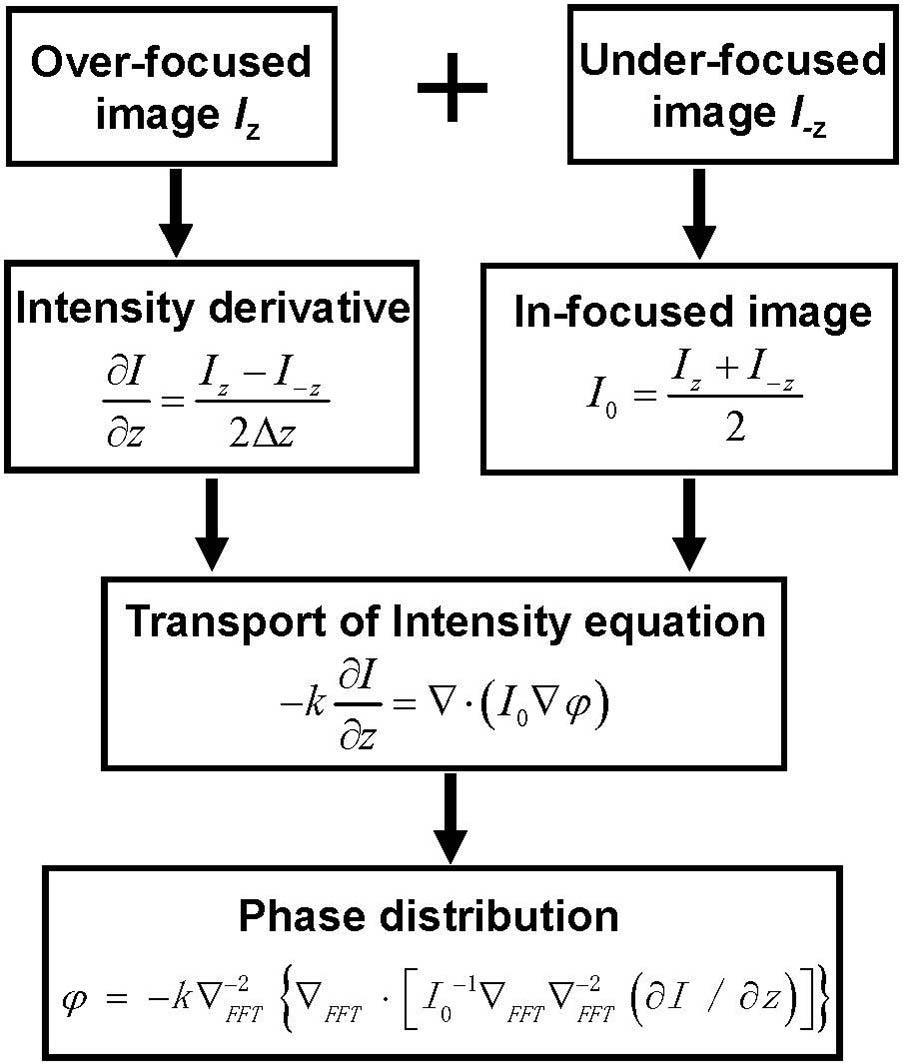
    Fig. 1. Flowchart of algorithm for QPM based on the TIE.
    (a) Experimental setup. D, diaphragm; BS, beam splitter; RR, retroreflector; M2, mirror 2. (b) 2D images of source pattern and corresponding phase transfer function for different coherence parameters. (c) Original lateral-flipped images in single shot. (d) Recovered phase map of the cell marked in the red box in (c). (e) Phase stability measurement during the 150 min experiment in the white box marked in (d).
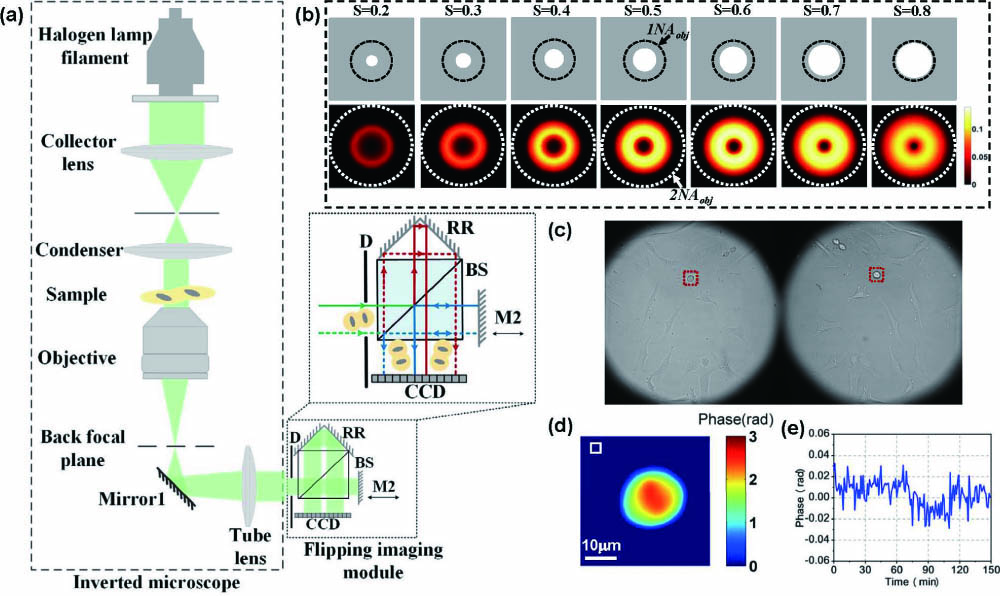
    Fig. 2. (a) Experimental setup. D, diaphragm; BS, beam splitter; RR, retroreflector; M2, mirror 2. (b) 2D images of source pattern and corresponding phase transfer function for different coherence parameters. (c) Original lateral-flipped images in single shot. (d) Recovered phase map of the cell marked in the red box in (c). (e) Phase stability measurement during the 150 min experiment in the white box marked in (d).
    (a), (b) Representative phase and corresponding intensity images of mitosis. (c), (d) Representative phase and corresponding intensity images of non-mitosis.
    Fig. 3. (a), (b) Representative phase and corresponding intensity images of mitosis. (c), (d) Representative phase and corresponding intensity images of non-mitosis.
    Workflow diagram and detailed architecture of DCNN for classification of mitosis and non-mitosis.
    Fig. 4. Workflow diagram and detailed architecture of DCNN for classification of mitosis and non-mitosis.
    Learning process of DCNN trained by phase and intensity images, respectively.
    Fig. 5. Learning process of DCNN trained by phase and intensity images, respectively.
    Performance and t-SNE visualization of the DCNN trained by phase and intensity images, respectively. In t-SNE visualization, number 1 represents mitosis and number 2 represents non-mitosis.
    Fig. 6. Performance and t-SNE visualization of the DCNN trained by phase and intensity images, respectively. In t-SNE visualization, number 1 represents mitosis and number 2 represents non-mitosis.
    Overall classification performance for DCNN trained by phase images, DCNN with intensity images and random forest trained by dry mass, respectively. (a) Accuracy. (b) Precision. (c) Recall. (d) F1 score.
    Fig. 7. Overall classification performance for DCNN trained by phase images, DCNN with intensity images and random forest trained by dry mass, respectively. (a) Accuracy. (b) Precision. (c) Recall. (d) F1 score.
    ClassifiersAccuracy (%)F1 Score (%)
    DCNN trained by phase images98.9097.40
    AlexNet[6]95.0894.35
    CNN only[2]96.1395.87
    Table 1. Comparison of Accuracy and F1 Score for Different Classifiers
    Ying Li, Jianglei Di, Li Ren, Jianlin Zhao. Deep-learning-based prediction of living cells mitosis via quantitative phase microscopy[J]. Chinese Optics Letters, 2021, 19(5): 051701
    Download Citation