• Photonics Research
  • Vol. 8, Issue 6, 806 (2020)
Yufeng Li1, Chenyu Wang1, Ye Zhang1、2, Peng Hu1, Shengnan Zhang2, Mengqi Du2, Xilin Su2, Qiang Li2, and Feng Yun1、2、*
Author Affiliations
  • 1Shaanxi Provincial Key Laboratory of Photonics & Information Technology, Xi’an Jiaotong University, Xi’an 710049, China
  • 2Solid-State Lighting Engineering Research Center, Xi’an Jiaotong University, Xi’an 710049, China
  • show less
    DOI: 10.1364/PRJ.387607 Cite this Article Set citation alerts
    Yufeng Li, Chenyu Wang, Ye Zhang, Peng Hu, Shengnan Zhang, Mengqi Du, Xilin Su, Qiang Li, Feng Yun. Analysis of TM/TE mode enhancement and droop reduction by a nanoporous n-AlGaN underlayer in a 290 nm UV-LED[J]. Photonics Research, 2020, 8(6): 806 Copy Citation Text show less
    (a) Epitaxial structure of the scribed via holes and porous layer. (b) Cross-sectional view of the nanoporous n-AlGaN layer etched at 40 V. (c) SEM image of the cleaved region in the porous layer showing the subwavelength grating structure at higher magnification.
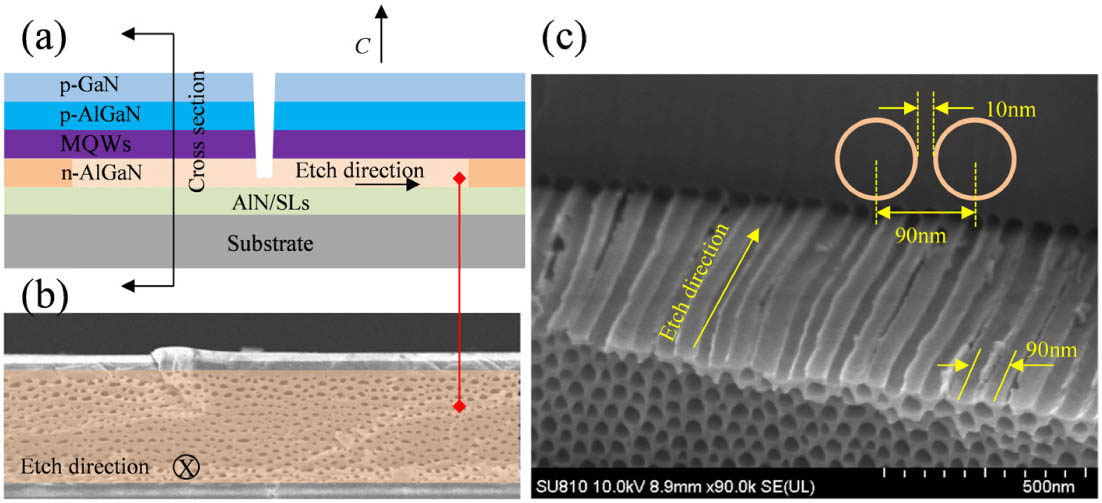
    Fig. 1. (a) Epitaxial structure of the scribed via holes and porous layer. (b) Cross-sectional view of the nanoporous n-AlGaN layer etched at 40 V. (c) SEM image of the cleaved region in the porous layer showing the subwavelength grating structure at higher magnification.
    (a) PL spectra of samples with different EC etching voltages. (b) Corrected PL enhancement ratio and average size of pore versus EC etching voltage.
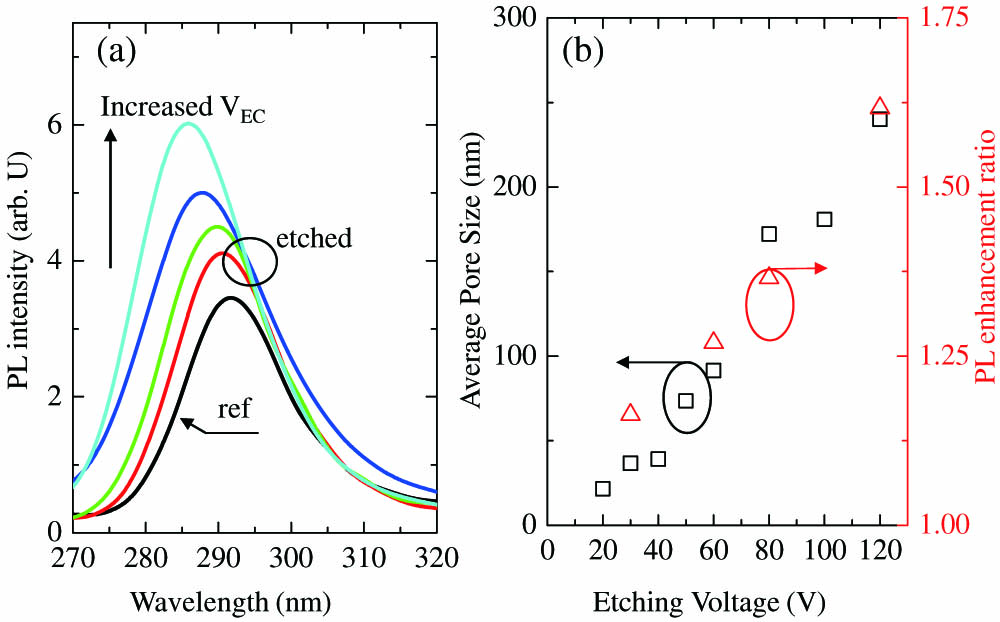
    Fig. 2. (a) PL spectra of samples with different EC etching voltages. (b) Corrected PL enhancement ratio and average size of pore versus EC etching voltage.
    (a) Raman spectra of the etched samples and the reference sample measured at RT. (b) Raman shift (left) and PL peak wavelength (right) as a function of etching voltages.
    Fig. 3. (a) Raman spectra of the etched samples and the reference sample measured at RT. (b) Raman shift (left) and PL peak wavelength (right) as a function of etching voltages.
    (a) Schematic diagram of the angular-dependent polarization PL measurement. (b) Far-field PL distribution in polar coordinates. (c) Enhancement ratio of samples etched at 60 V and 80 V as a function of θ.
    Fig. 4. (a) Schematic diagram of the angular-dependent polarization PL measurement. (b) Far-field PL distribution in polar coordinates. (c) Enhancement ratio of samples etched at 60 V and 80 V as a function of θ.
    Angular-dependent PL intensity profile in the (a) TE and (b) TM mode; (c) the side-emitting PL spectra at different polarization angles: ψ=0°, ψ=90°, when θ=60°; (d) the integrated PL intensity against polarization angle ψ=0°–360° of the reference unetched sample and 80 V etched sample, respectively.
    Fig. 5. Angular-dependent PL intensity profile in the (a) TE and (b) TM mode; (c) the side-emitting PL spectra at different polarization angles: ψ=0°, ψ=90°, when θ=60°; (d) the integrated PL intensity against polarization angle ψ=0°360° of the reference unetched sample and 80 V etched sample, respectively.
    EL spectra and normalized EQE versus current of (a), (c) the 80 V etched sample compared to (b), (d) the reference sample. The inset of (a) shows the schematic of the porous LED.
    Fig. 6. EL spectra and normalized EQE versus current of (a), (c) the 80 V etched sample compared to (b), (d) the reference sample. The inset of (a) shows the schematic of the porous LED.
    Yufeng Li, Chenyu Wang, Ye Zhang, Peng Hu, Shengnan Zhang, Mengqi Du, Xilin Su, Qiang Li, Feng Yun. Analysis of TM/TE mode enhancement and droop reduction by a nanoporous n-AlGaN underlayer in a 290 nm UV-LED[J]. Photonics Research, 2020, 8(6): 806
    Download Citation