• Acta Optica Sinica
  • Vol. 38, Issue 6, 0630002 (2018)
Xinming Zhuang1、3, Shenyu Li2、3, Fei Li2、3, and Junsheng Yuan2、3、4、*
Author Affiliations
  • 1 School of Chemical Engineering, Hebei University of Technology, Tianjin 300130, China
  • 2 School of Marine Science and Engineering, Hebei University of Technology, Tianjin 300130, China
  • 3 Engineering Research Center of Seawater Utilization Technology of Ministry of Education, School of Marine Science and Engineering, Hebei University of Technology, Tianjin 300130, China
  • 4 College of Chemical Engineering and Materials Science, Quanzhou Normal University, Quanzhou, Fujian 362000, China
  • show less
    DOI: 10.3788/AOS201838.0630002 Cite this Article Set citation alerts
    Xinming Zhuang, Shenyu Li, Fei Li, Junsheng Yuan. Excess Raman Spectroscopy of Ammonium Sulfate Aqueous Solution[J]. Acta Optica Sinica, 2018, 38(6): 0630002 Copy Citation Text show less
    (a) Raman spectra and (b) excess Raman spectra in O-H stretching vibration interval of (NH4)2SO4 aqueous solution with different mass fractions
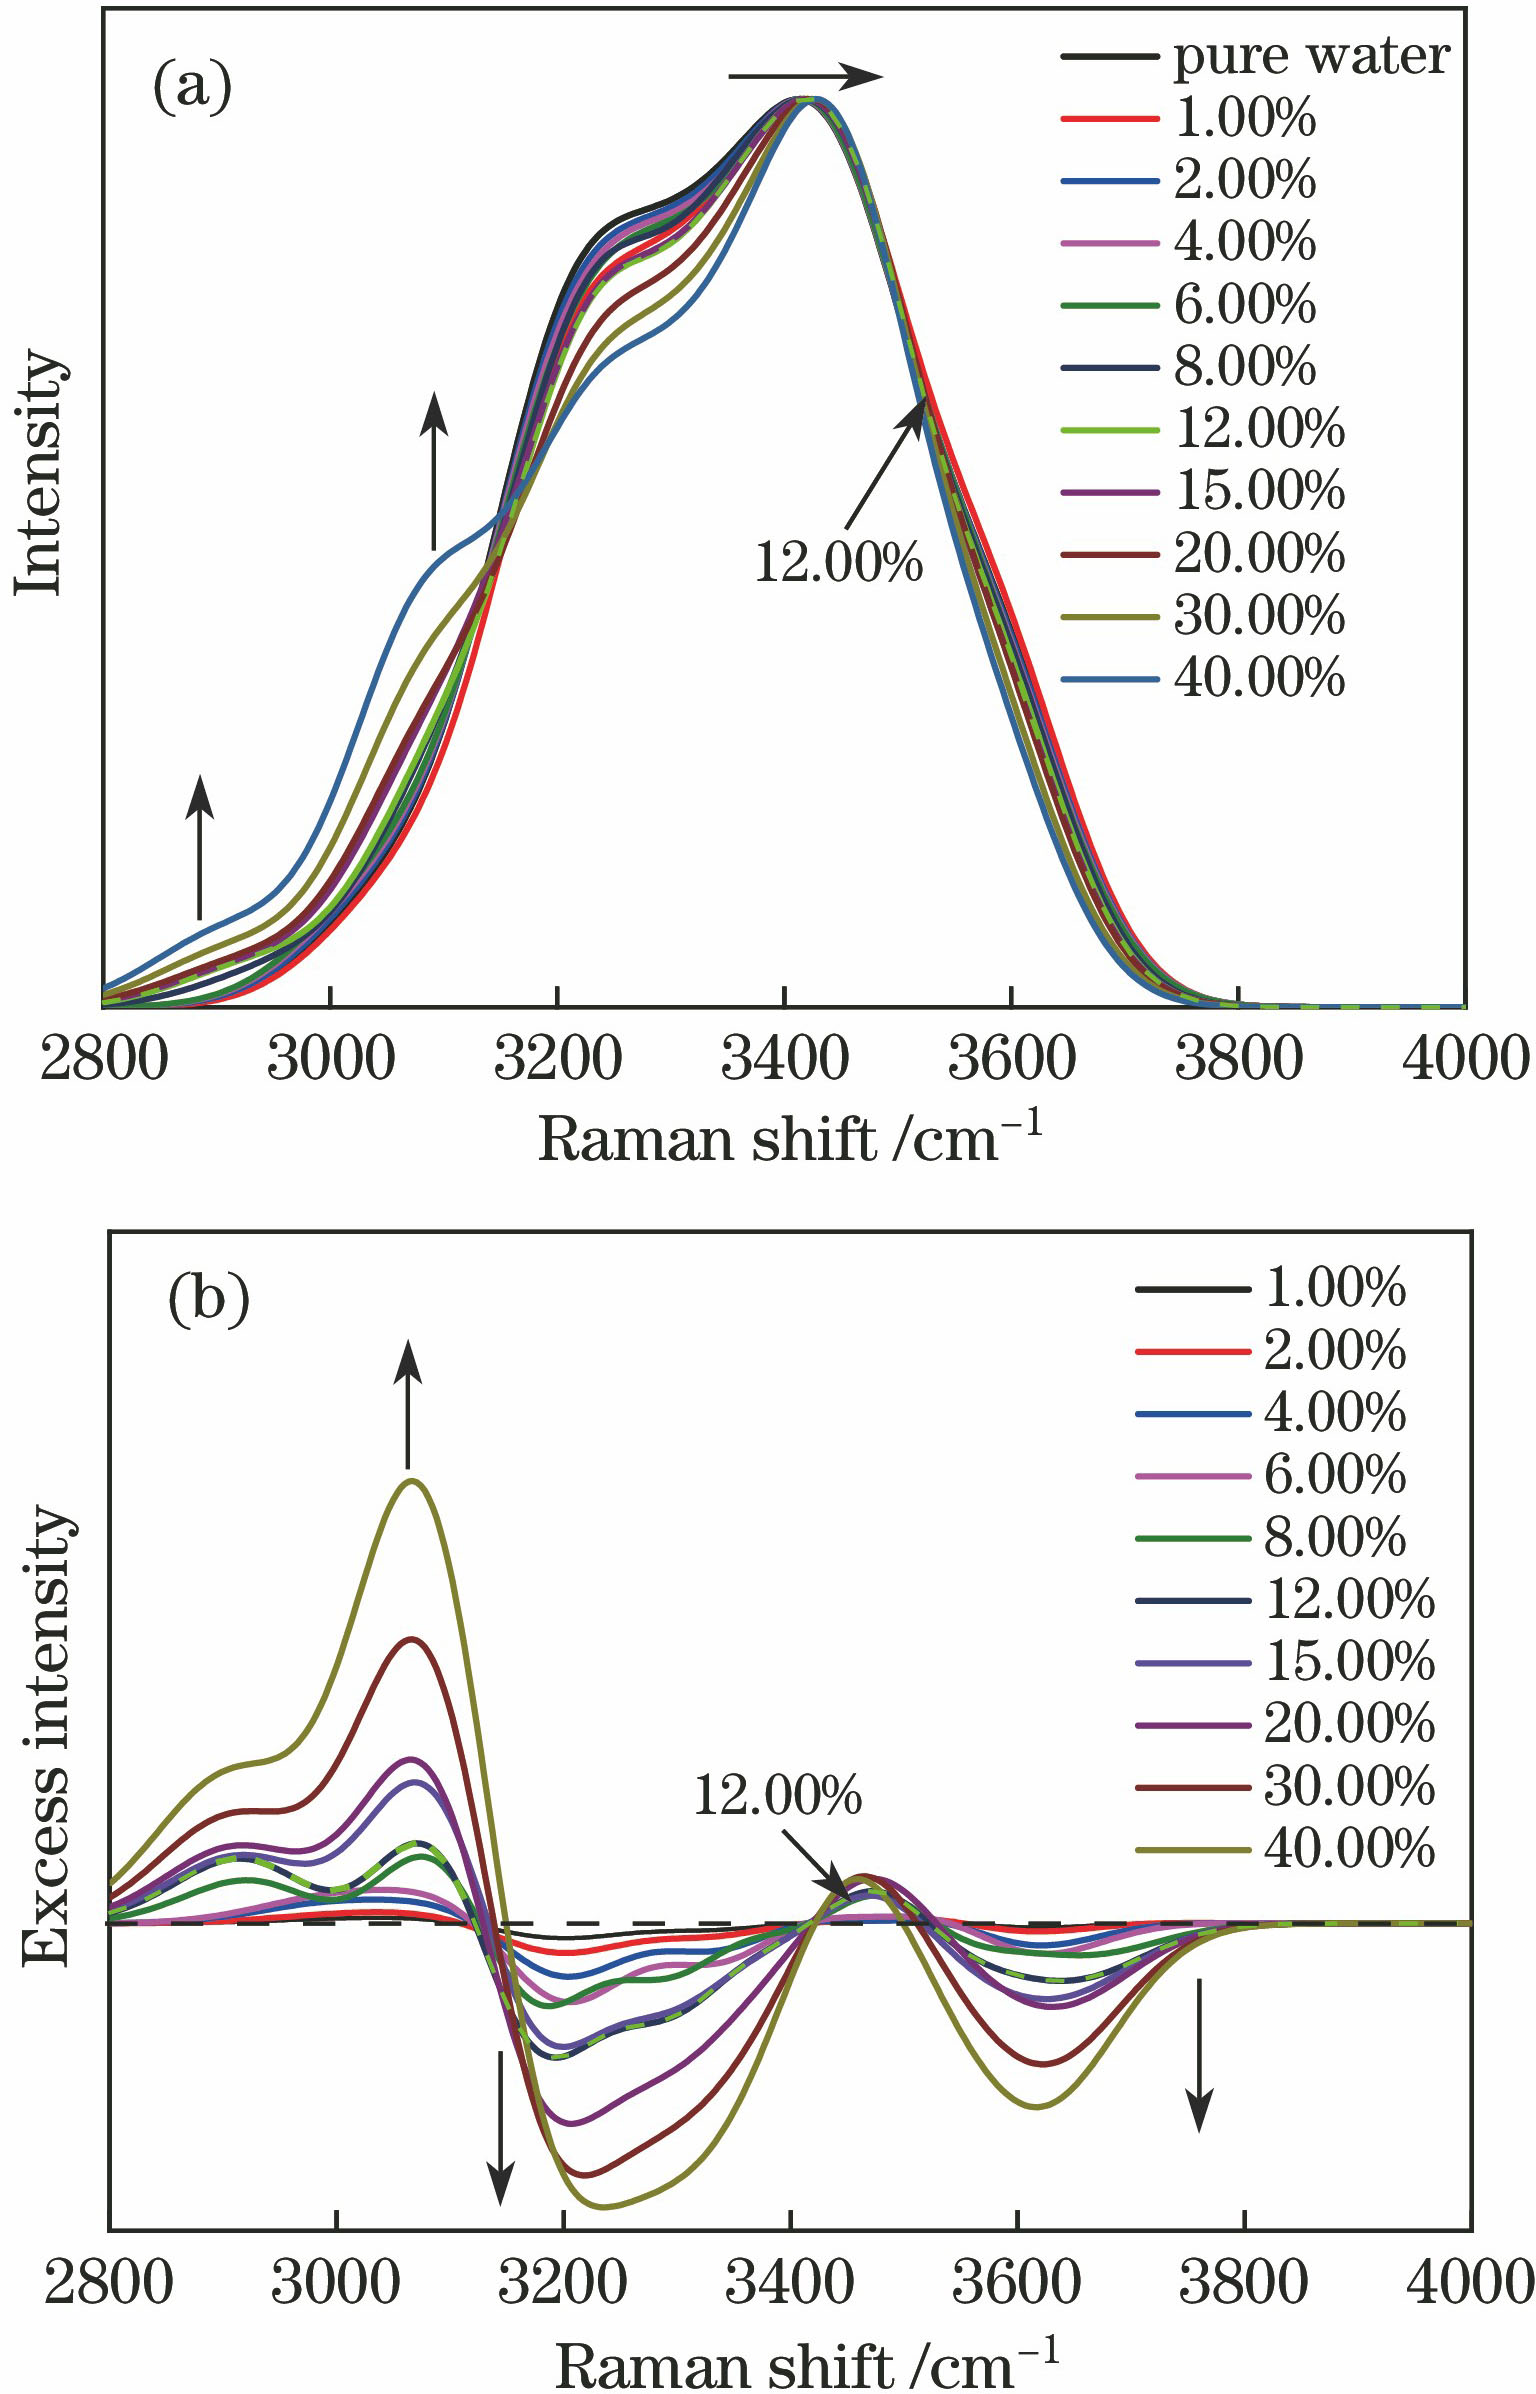
    Fig. 1. (a) Raman spectra and (b) excess Raman spectra in O-H stretching vibration interval of (NH4)2SO4 aqueous solution with different mass fractions
    Peak splitting data in O-H stretching vibration interval of (NH4)2SO4 aqueous solution with mass fractions of (a) 8.00% and (b) 12.00%
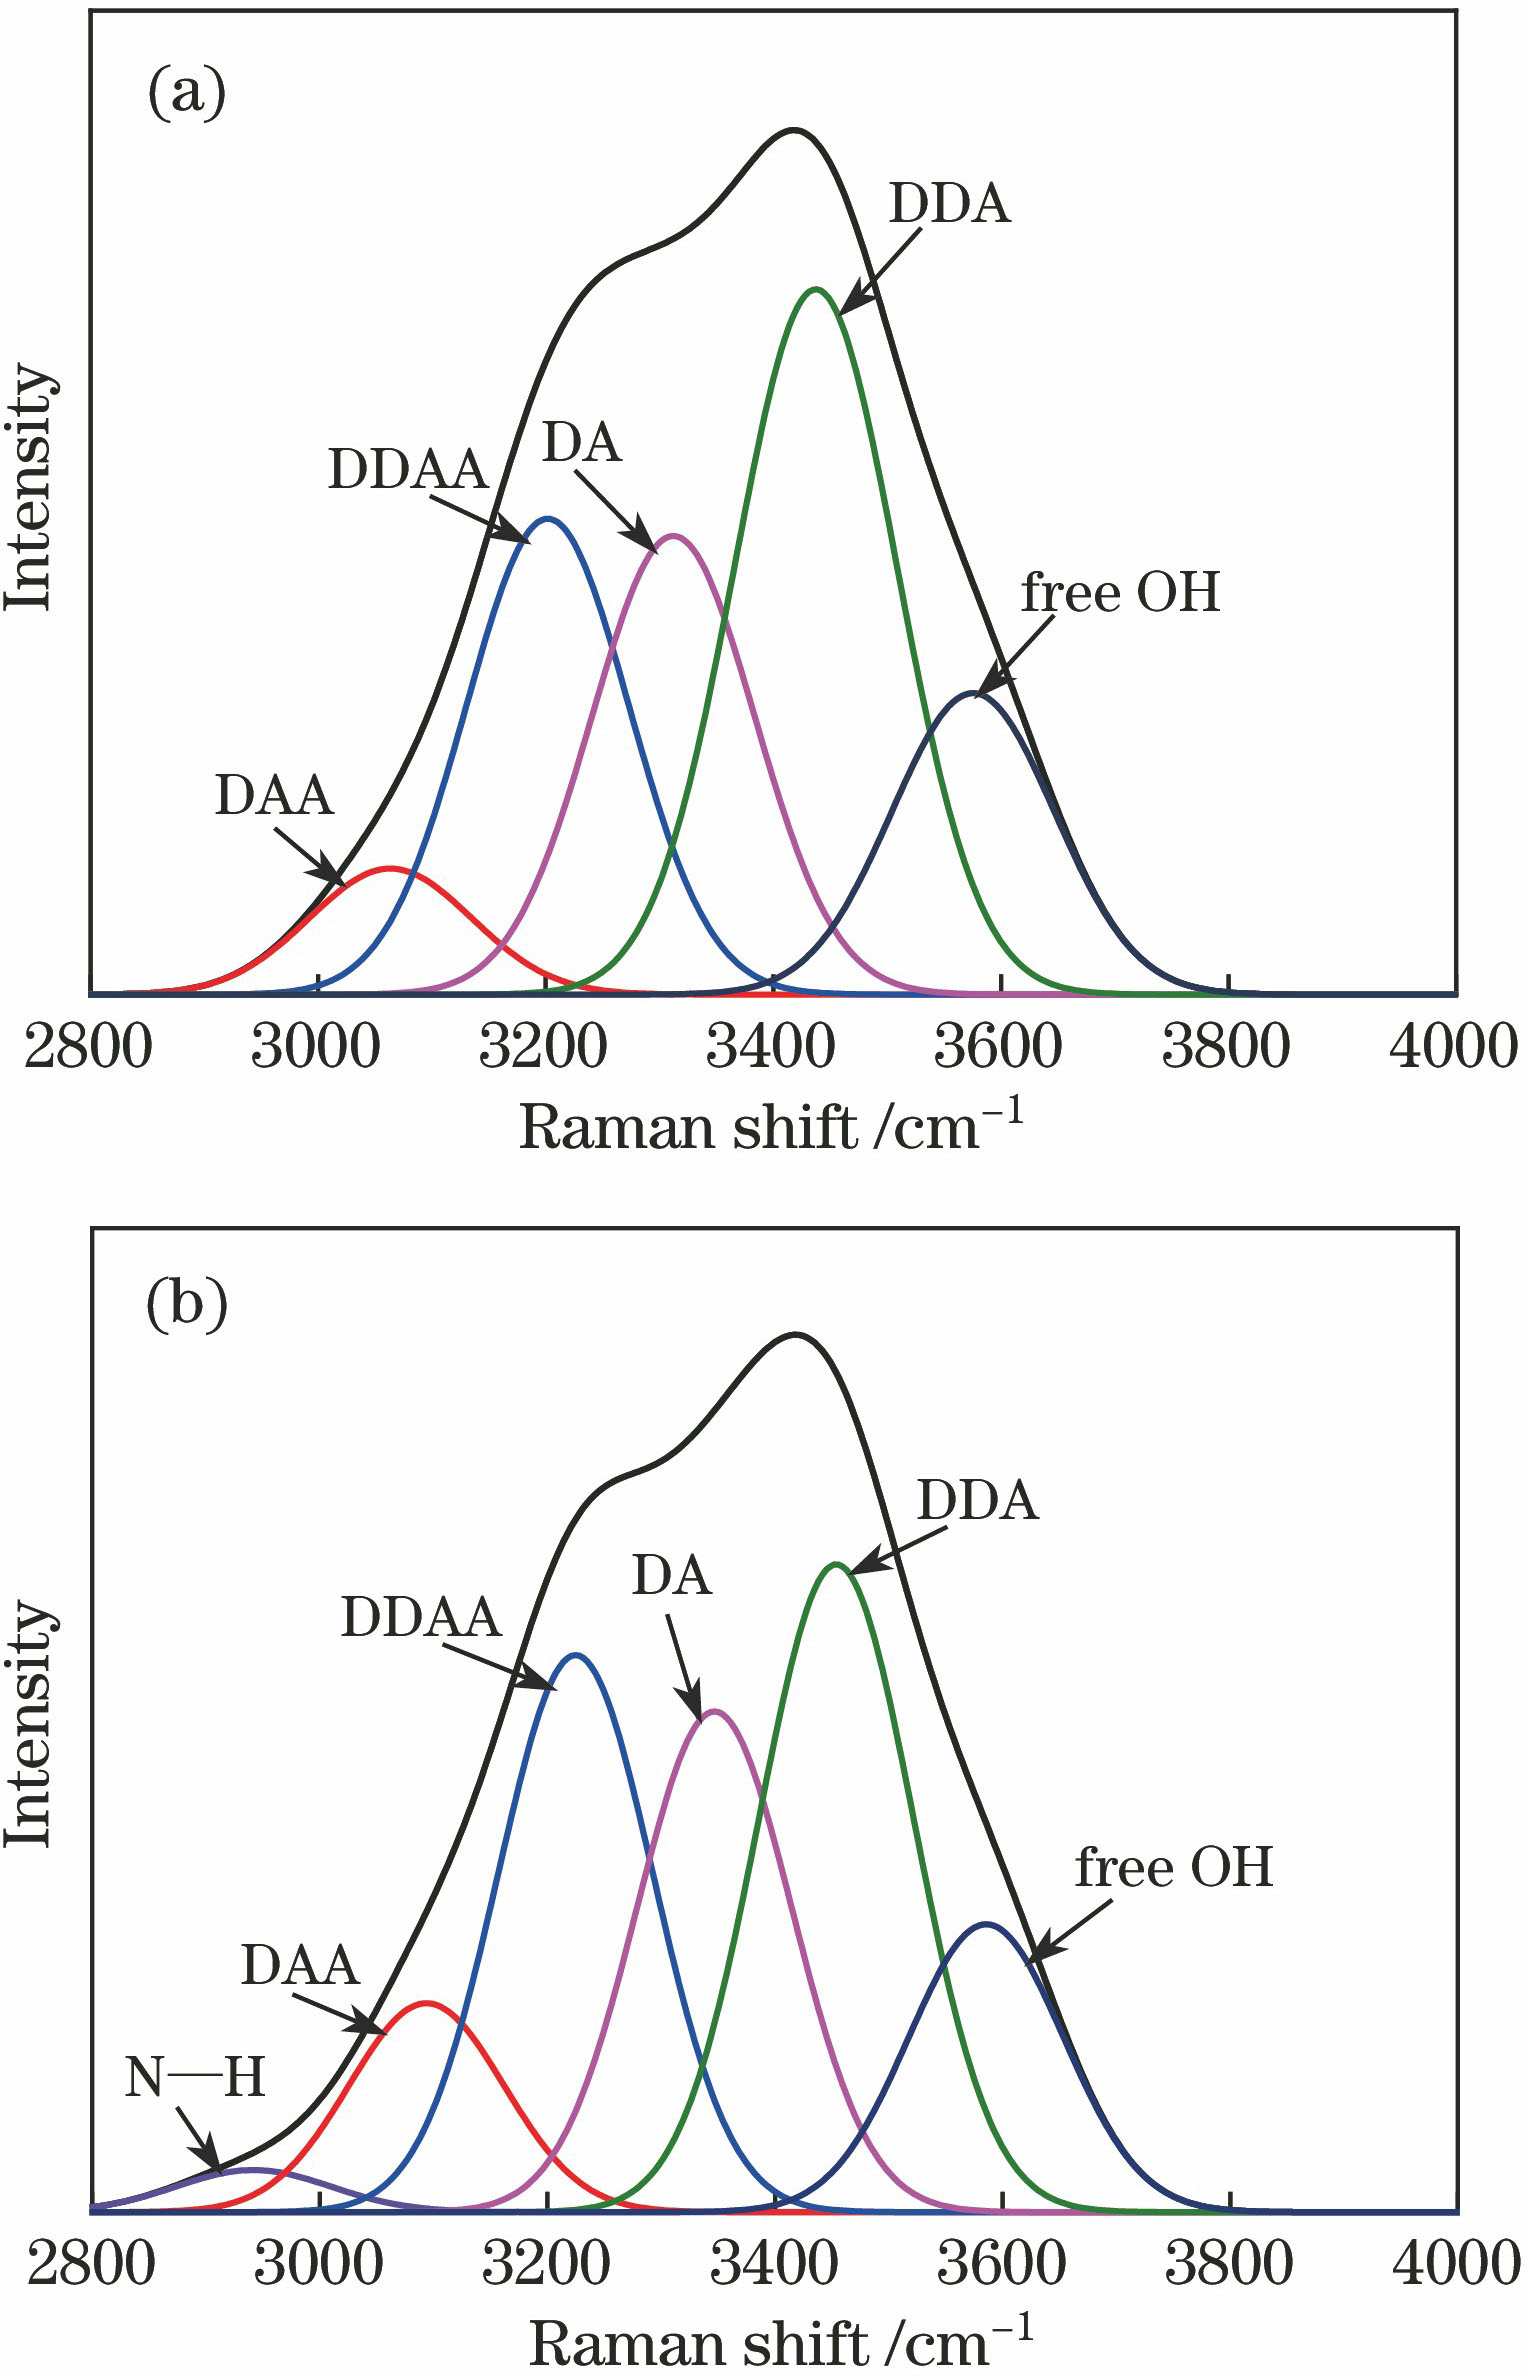
    Fig. 2. Peak splitting data in O-H stretching vibration interval of (NH4)2SO4 aqueous solution with mass fractions of (a) 8.00% and (b) 12.00%
    Hydrogen bond structures in aqueous solution. (a) DDAA type; (b) DDA type; (c) DAA type; (d) DA type
    Fig. 3. Hydrogen bond structures in aqueous solution. (a) DDAA type; (b) DDA type; (c) DAA type; (d) DA type
    Hydrogen bond structures in (NH4)2SO4 aqueous solution with different mass fractions
    Fig. 4. Hydrogen bond structures in (NH4)2SO4 aqueous solution with different mass fractions
    Integral area of positive peak of excess Raman spectra in O-H stretching vibration interval of (NH4)2SO4 aqueous solution versus mass fraction
    Fig. 5. Integral area of positive peak of excess Raman spectra in O-H stretching vibration interval of (NH4)2SO4 aqueous solution versus mass fraction
    (a) Characteristic peak spectra and (b) normalized data of SO42- in (NH4)2SO4 aqueous solution with different mass fractions
    Fig. 6. (a) Characteristic peak spectra and (b) normalized data of SO42- in (NH4)2SO4 aqueous solution with different mass fractions
    Excess Raman spectra of SO42- holosymmetric stretching vibration interval in (NH4)2SO4 aqueous solution with different mass fractions
    Fig. 7. Excess Raman spectra of SO42- holosymmetric stretching vibration interval in (NH4)2SO4 aqueous solution with different mass fractions
    Variations of (a) positive peak integral area and (b) negative integral area of SO42- excess Raman spectra with mass fraction
    Fig. 8. Variations of (a) positive peak integral area and (b) negative integral area of SO42- excess Raman spectra with mass fraction
    Sample numberw[(NH4)2SO4] /%Density /(g·mL-1)Concentration /(mol·L-1)n[(NH4)2SO4]∶n(H2O)
    11.001.00410.07551∶726.0
    22.001.01010.15271∶359.5
    34.001.02200.30771∶176.0
    46.001.03260.46811∶115.0
    58.001.04560.62231∶84.5
    612.001.06190.95951∶53.8
    715.001.08431.23141∶41.2
    820.001.11541.67771∶29.3
    930.001.17042.62261∶17.1
    1040.001.22773.66461∶11.0
    Table 1. Mass fraction and mole ratio of (NH4)2SO4 aqueous solution
    Xinming Zhuang, Shenyu Li, Fei Li, Junsheng Yuan. Excess Raman Spectroscopy of Ammonium Sulfate Aqueous Solution[J]. Acta Optica Sinica, 2018, 38(6): 0630002
    Download Citation