• Laser & Optoelectronics Progress
  • Vol. 58, Issue 19, 1916001 (2021)
Hao Li, Qingxin Zhou, Shenghua Ma, and Gang Wang*
Author Affiliations
  • Institute of Photonics & Photon-Technology, Northwest University, State Key Laboratory of Photon-Technology in Western China Energy, National Center for International Research of Photoelectric Technology & Nano-Functional Materials and Application, Key Laboratory of Photoelectron Technology of Shaanxi Province, Xi'an , Shaanxi 710127, China
  • show less
    DOI: 10.3788/LOP202158.1916001 Cite this Article Set citation alerts
    Hao Li, Qingxin Zhou, Shenghua Ma, Gang Wang. Preparation of Photothermal Membrane and Catalytic Performance of Photo-Fenton[J]. Laser & Optoelectronics Progress, 2021, 58(19): 1916001 Copy Citation Text show less
    Preparation and degradation process diagram of photothermal membrane(PTM)
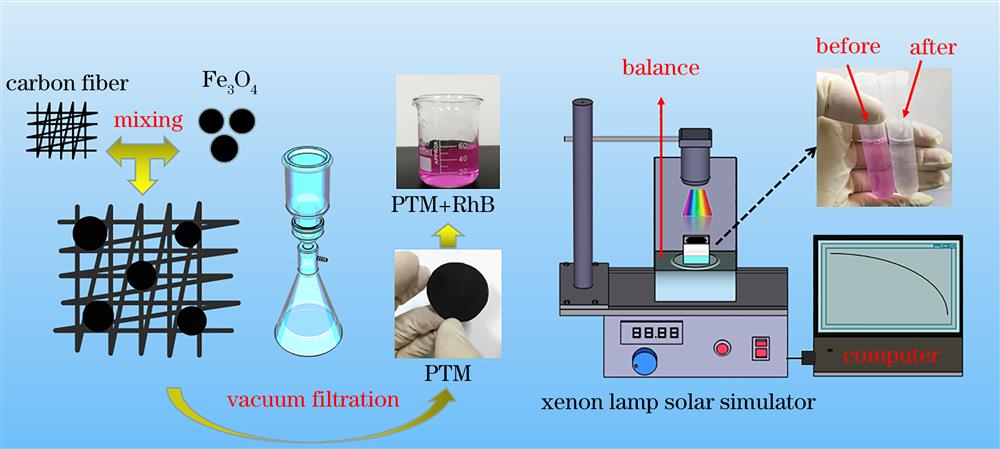
    Fig. 1. Preparation and degradation process diagram of photothermal membrane(PTM)
    Morphologies of carbon fiber (CF) and Fe3O4. (a)‒(c) SEM images of carbon fiber; (d)‒(f) TEM images of carbon fiber; (g)‒(h) SEM images of Fe3O4; (i) TEM image of Fe3O4
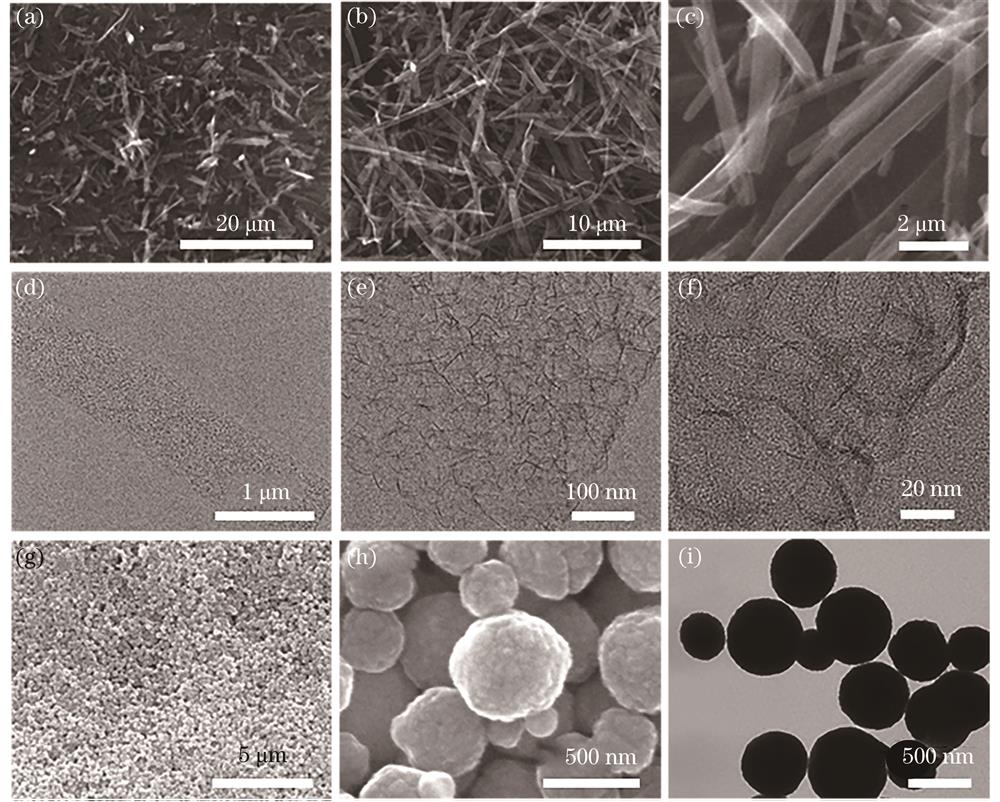
    Fig. 2. Morphologies of carbon fiber (CF) and Fe3O4. (a)‒(c) SEM images of carbon fiber; (d)‒(f) TEM images of carbon fiber; (g)‒(h) SEM images of Fe3O4; (i) TEM image of Fe3O4
    XRD spectra, N2 adsorption-desorption diagram, pore size diagram, and visible light absorption spectrum of the prepared samples. (a) XRD pattern of Fe3O4; (b) XRD pattern of MgCO3·3H2O fiber; (c) XRD patterns of carbon fiber and MgO-C fiber; (d) N2 adsorption-desorption diagram of carbon fiber; (e) pore size analysis diagram of carbon fiber; (f) PTM's absorption rate of sunlight in the visible light band
    Fig. 3. XRD spectra, N2 adsorption-desorption diagram, pore size diagram, and visible light absorption spectrum of the prepared samples. (a) XRD pattern of Fe3O4; (b) XRD pattern of MgCO3·3H2O fiber; (c) XRD patterns of carbon fiber and MgO-C fiber; (d) N2 adsorption-desorption diagram of carbon fiber; (e) pore size analysis diagram of carbon fiber; (f) PTM's absorption rate of sunlight in the visible light band
    PTM contact angle tests and physical and infrared photos during catalytic degradation process. (a) PTM contact angle test: top hydrophobic image; (b) PTM contact angle test: bottom hydrophilic image; (c) experimental photo and physical image of PTM (upper right); (d) infrared image of the side and top (upper right) of the beaker; (e) picture of solution after catalytic degradation
    Fig. 4. PTM contact angle tests and physical and infrared photos during catalytic degradation process. (a) PTM contact angle test: top hydrophobic image; (b) PTM contact angle test: bottom hydrophilic image; (c) experimental photo and physical image of PTM (upper right); (d) infrared image of the side and top (upper right) of the beaker; (e) picture of solution after catalytic degradation
    Influence of different parameters on the degradation of RhB photo-Fenton. (a) Influence of different conditions; (b) influence of pH value on the degradation of RhB; (c) influence of the amount of H2O2 on the degradation of RhB; (d) influence of solar radiation density on the degradation of RhB
    Fig. 5. Influence of different parameters on the degradation of RhB photo-Fenton. (a) Influence of different conditions; (b) influence of pH value on the degradation of RhB; (c) influence of the amount of H2O2 on the degradation of RhB; (d) influence of solar radiation density on the degradation of RhB
    Schematic of high-efficiency photo-Fenton catalytic system
    Fig. 6. Schematic of high-efficiency photo-Fenton catalytic system
    Cycling number12345678910
    Degradation rate /%10099.599.298.698.096.895.294.593.392.6
    Table 1. Photo-Fenton catalytic cycle test of PTM
    Hao Li, Qingxin Zhou, Shenghua Ma, Gang Wang. Preparation of Photothermal Membrane and Catalytic Performance of Photo-Fenton[J]. Laser & Optoelectronics Progress, 2021, 58(19): 1916001
    Download Citation