
Xi WANG, Jian LIU, Bing-Yun YANG. Research on summer Arctic cloud detection model based on FY-3D/MERSI-II infrared data[J]. Journal of Infrared and Millimeter Waves, 2022, 41(2): 483
- Journal of Infrared and Millimeter Waves
- Vol. 41, Issue 2, 483 (2022)
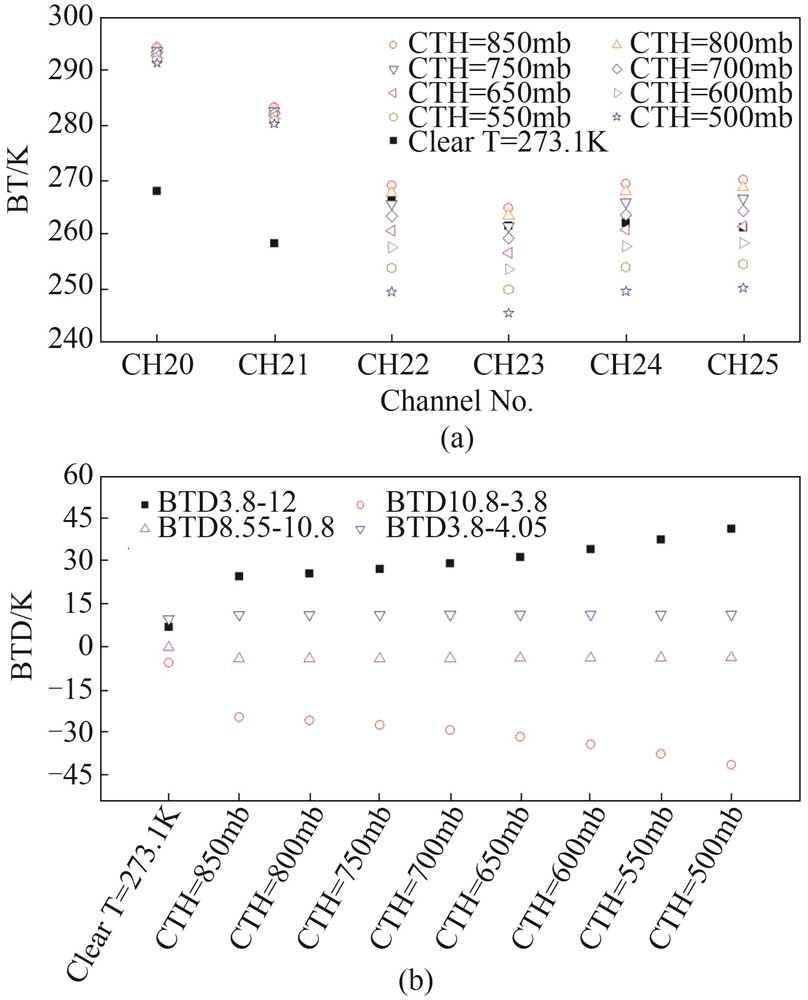
Fig. 1. Simulated results of Arctic summer clear and cloudy conditions over sea ice cover by Streamer model(a)brightness temperature and(b)brightness temperature difference of selected channels from FY3D in this study
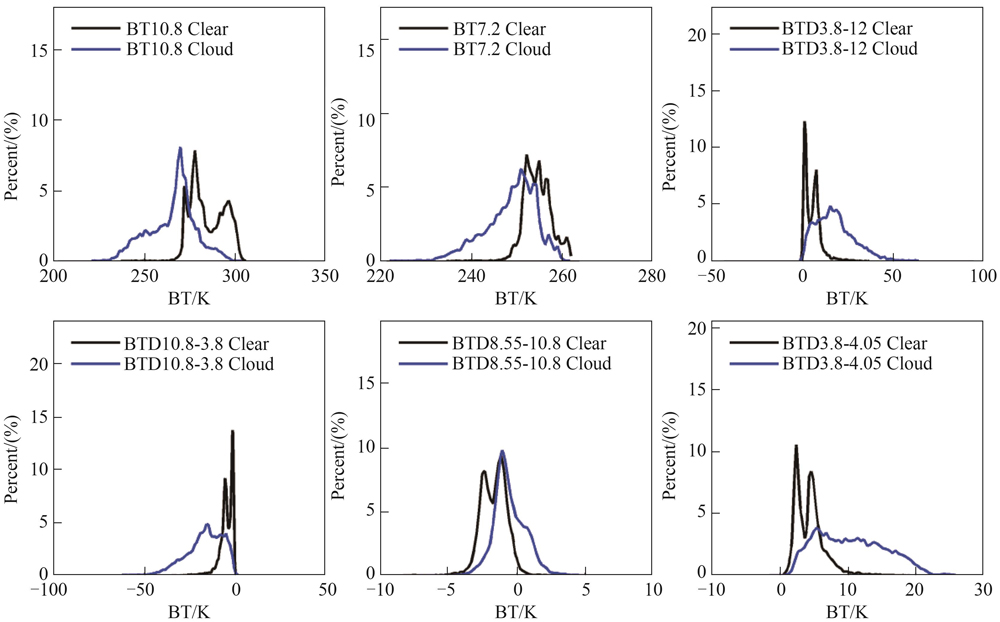
Fig. 2. Probability Distribution Functions for clear and cloudy pixels of different cloud detecting tests over land regions based on the data from FY3D/MERSI-II(black lines:clear;blue lines:cloudy)
Fig. 3. Same as Fig. 2 for ocean regions
Fig. 4. Same as Fig. 2 for sea ice regions
Fig. 5. Thresholds of different cloud detecting tests for ocean,land,and sea ice regions. The gray horizontal line represents the clear condition;the blue horizontal line represents the cloudy condition. The starting point of the horizontal line represents the maximum and minimum value of the distribution;the center of the line represents the median of the distribution;the vertical line represents the threshold(black:ocean;red:land;green:sea ice)
Fig. 6. A case of(a)final confidence level of cloud detection and(b)brightness temperature of infrared window channel 10.8 μm at 0625UTC on June 10,2020
Fig. 7. Same case as Fig. 6 for brightness temperature of infrared window channel 10.8 μm and its matching CALIPSO scanning track(yellow line)
Fig. 8. Same case as Fig. 6.(a)final confidence level of cloud detection(black lines)vs. CALIPSO cloud top height(blue lines);(b)ratios of clear and cloudy pixels in the corresponding interval of confidence level,where the interval is set as:0~0.2,0.2~0.4,0.4~0.6,0.6~0.8,0.8~1.0
|
Table 1. Characteristics of channels of FY-3D/ MERSI-II applied in this study
| ||||||||||||||||||||||||||||||||||||||||||||||||||||||||||||||||||||||||||||||||||||||||
Table 2. Thresholds and loss functions of different cloud detecting tests for different surface types
| |||||||||||||||||||||||||||||||||||||||||||||||||||||||||||||||||||||||||||||||||||||||
Table 3. HR results and weighting functions of cloud detecting tests by FY-3D/MERSI-II for Arctic summer

Set citation alerts for the article
Please enter your email address
© Copyright 2018-2021 | Chinese Laser Press. All Rights Reserved 沪ICP备15018463号-20