
Sen Wang, Xing Wu, Yinhui Zhang, Qing Chen. Surface Crack Segmentation Based on Multi-Scale Wavelet Transform and Structured Forest[J]. Acta Optica Sinica, 2018, 38(8): 0815024
- Acta Optica Sinica
- Vol. 38, Issue 8, 0815024 (2018)
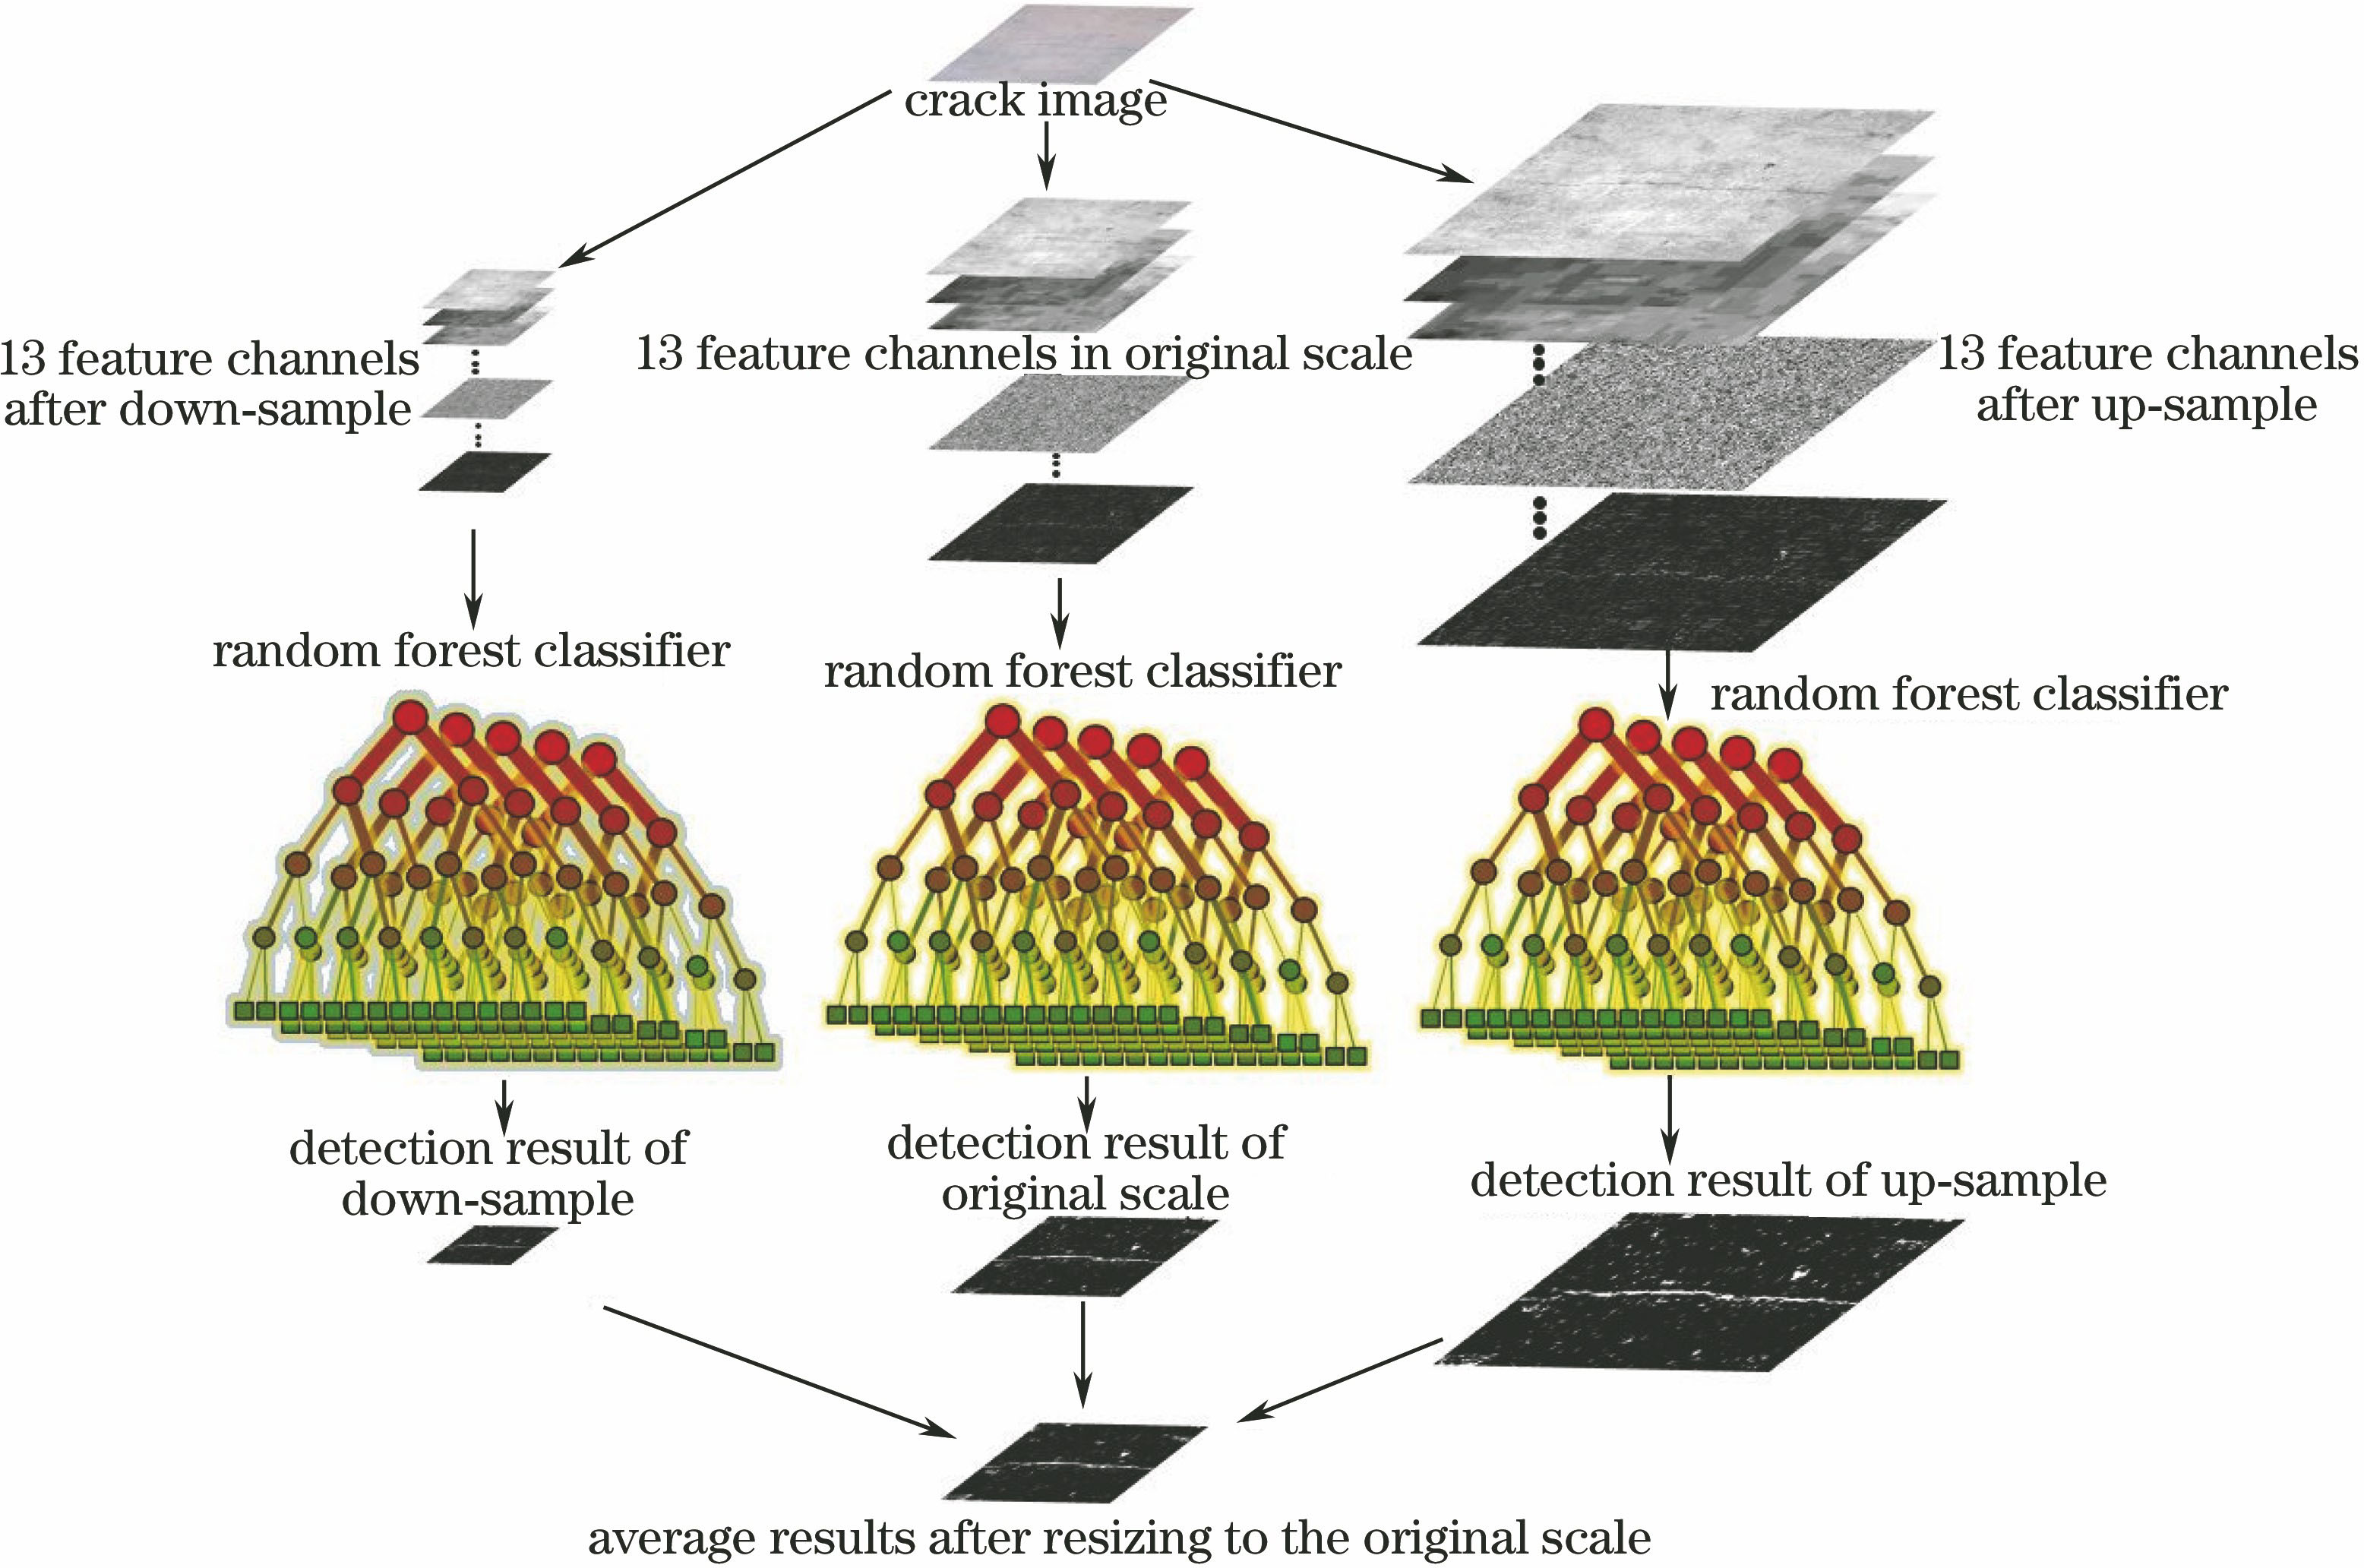
Fig. 1. Flowchart of SFW method
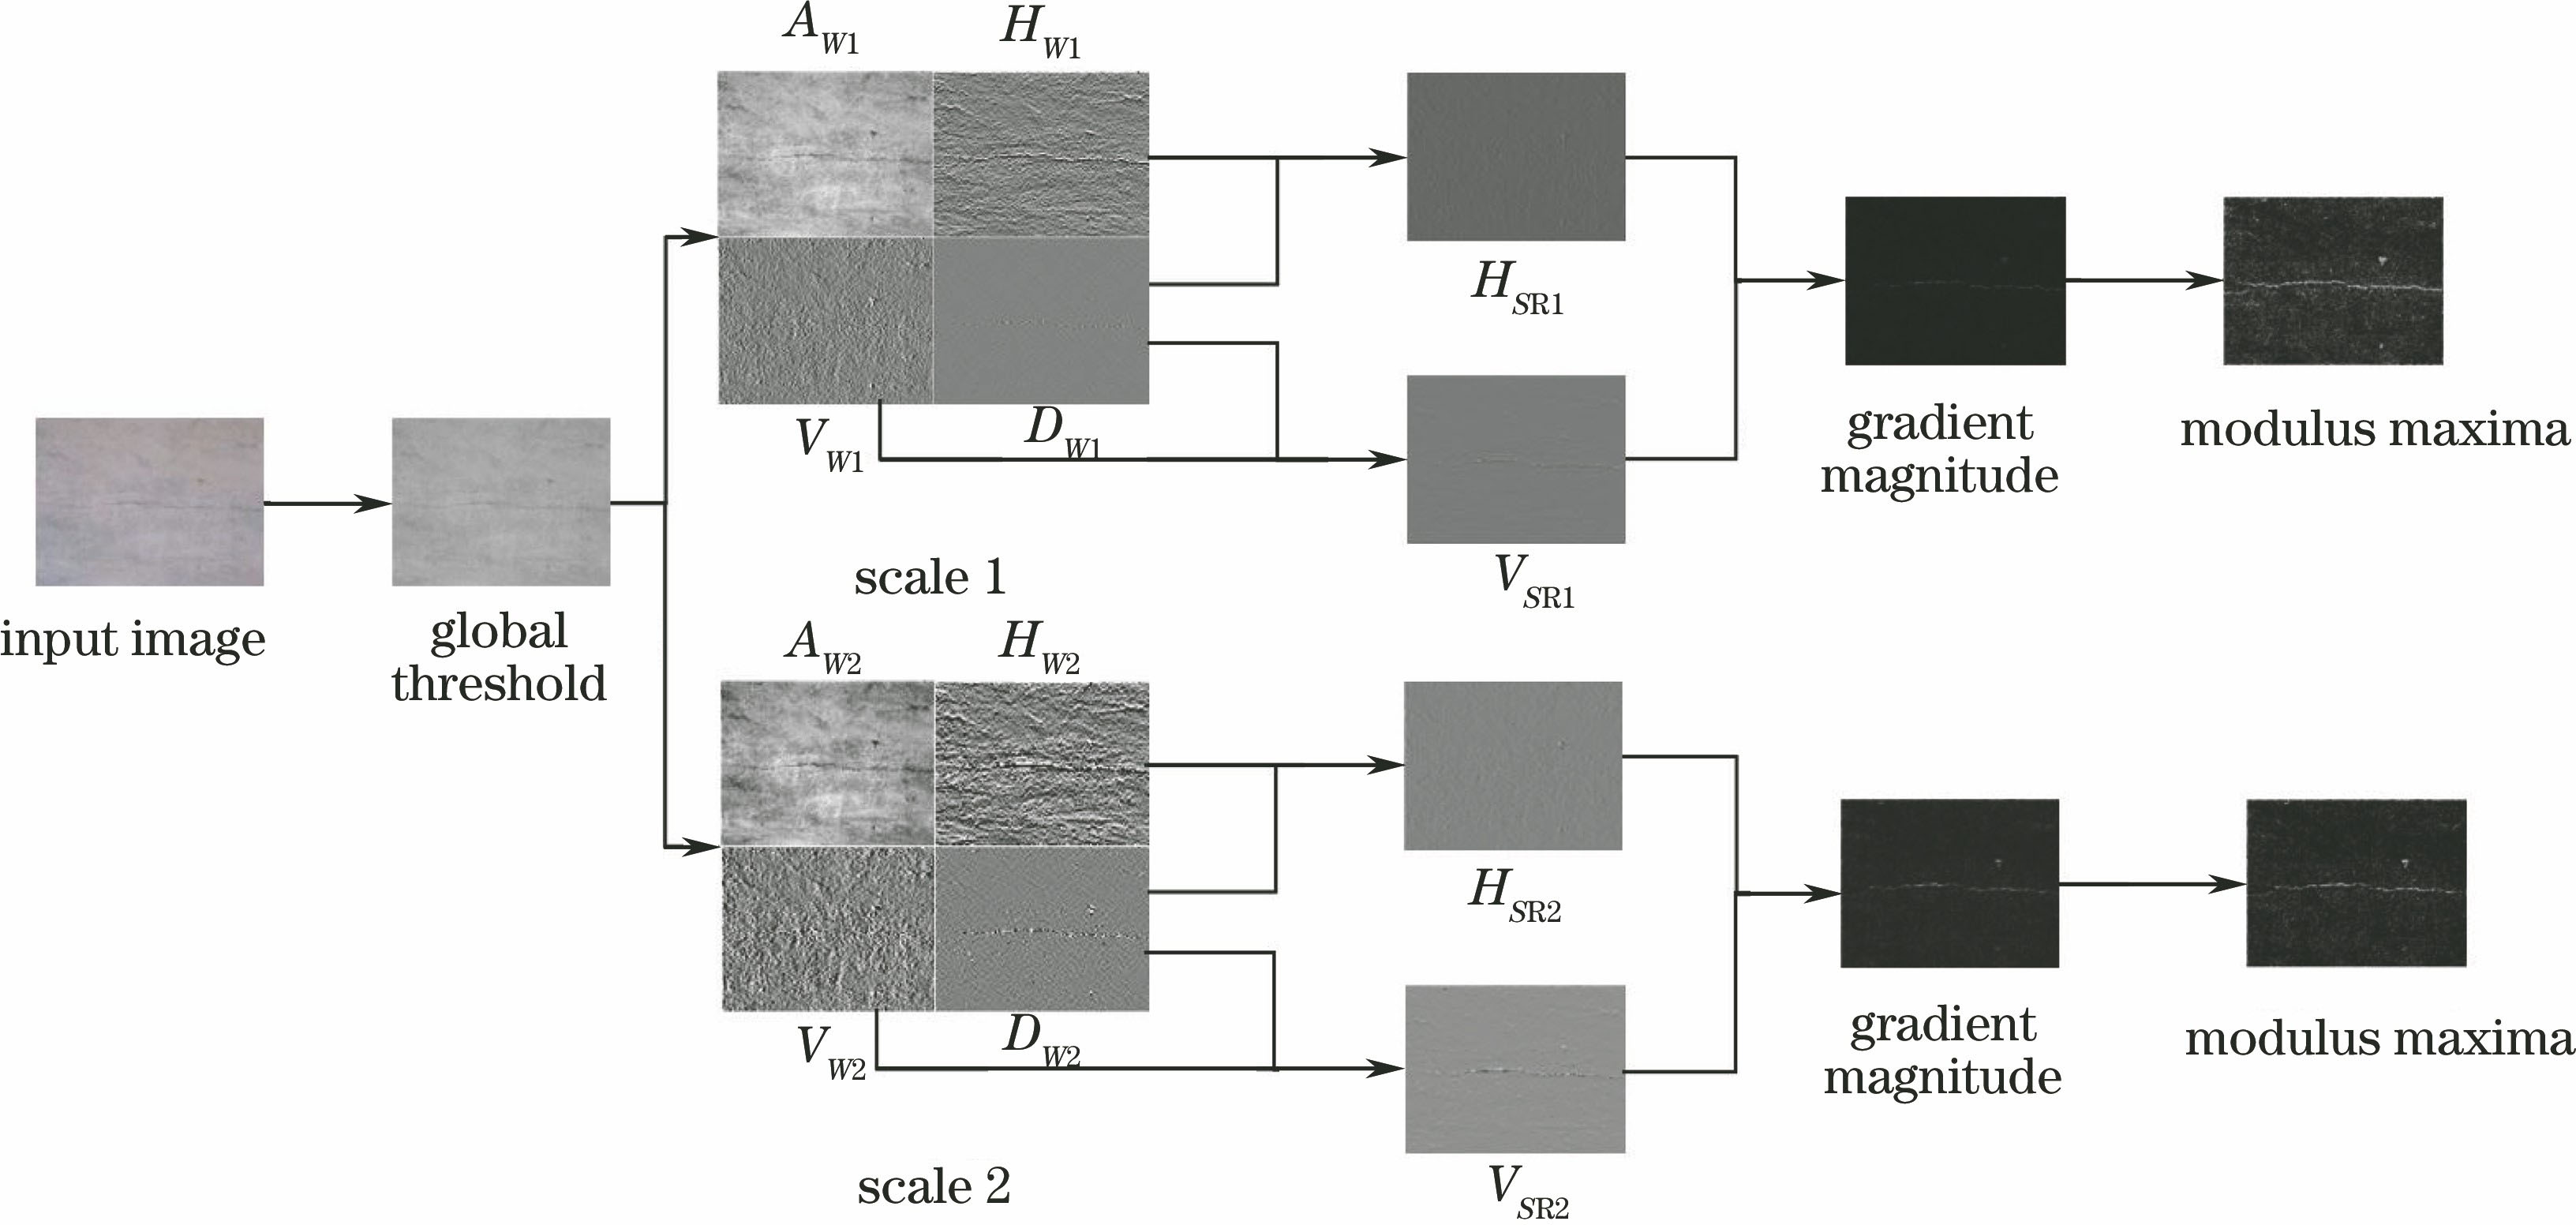
Fig. 2. Flowchart of modulus maxima edge detection method with wavelet semi-reconfiguration
Fig. 3. 13 feature channels of wall crack
Fig. 4. Feature vectors and structured labels
Fig. 5. Qualitative comparisons of wavelets with traditional detection methods. (a) Original image; (b) GT; (c) hrbio1.1-1; (d) rbior1.1-2; (e) sym2-1; (f) coif1-1; (g) dyadic-2; (h) dmey-1; (i) Prewitt; (j) Sobel; (k) Robert; (l) Canny; (m) Log
Fig. 6. ROC curves and RPFM bars of six wavelets and six other methods. (a) ROC curves; (b) RPFM bars
Fig. 7. Quantitative comparisons of SFW classifier in train and validation. (a) nSample; (b) nCell; (c) normRad; (d) chSmooth; (e) simSmooth; (f) imWidth; (g) gtWidth; (h) fracFtrs; (i) maxDepth; (j) minChild; (k) sharpen; (l) nTree
Fig. 8. Qualitative comparisons of different methods. (a) Original image 1; (b) GT1; (c) hrbio1.1-1; (d) rbior1.1-2; (e) dyadic-2; (f) sym2-1; (g) coif1-1; (h) dmey-1; (i) original image 2; (j) GT2; (k) SFW-M (hrbio1.1-1); (l) SFW-1; (m) SFD-M; (n) SFD-1; (o) FCN-8s; (p) MDW Ncut
Fig. 9. ROC curve and RPFM bars of 11 methods. (a) ROC curves; (b) RPFM bars
Fig. 10. Quantitative comparisons of 5 methods. (a) Original image; (b) GT; (c) SFW; (d) FCN-8s; (e) SFD; (f) Canny; (g) original image; (h) GT; (i) SFW; (j) FCN-8s; (k) SFD; (l) Canny
Fig. 11. ROC curves of two types of images with five methods. (a) First type; (b) second type
|
Table 1. Average comparisons of 11 methods with 5 quantitative methods
|
Table 2. Quantitative comparisons of five methods


Set citation alerts for the article
Please enter your email address

© Copyright 2018-2021 | Chinese Laser Press. All Rights Reserved 沪ICP备15018463号-20