• Spectroscopy and Spectral Analysis
  • Vol. 42, Issue 6, 1735 (2022)
Zhi-rong YU* and Ming-jian HONG*;
Author Affiliations
  • School of Big Data & Software Engineering, Chongqing University, Chongqing 401331, China
  • show less
    DOI: 10.3964/j.issn.1000-0593(2022)06-1735-06 Cite this Article
    Zhi-rong YU, Ming-jian HONG. Near-Infrared Spectral Quantitative Analysis Network Based on Grouped Fully Connection[J]. Spectroscopy and Spectral Analysis, 2022, 42(6): 1735 Copy Citation Text show less
    The structure of GFCN model
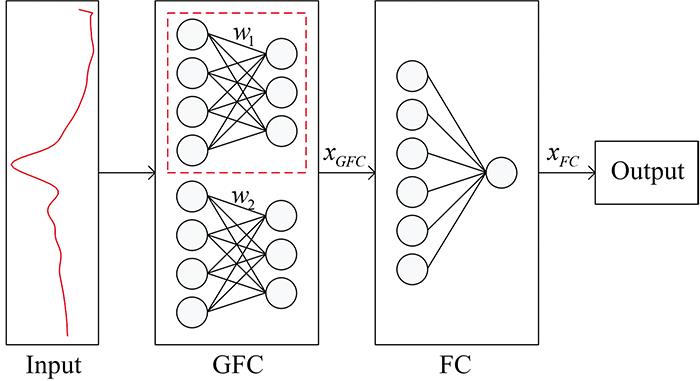
    Fig. 1. The structure of GFCN model
    The spectra after preprocess(a): Tecator dataset; (b): IDRC2018 dataset
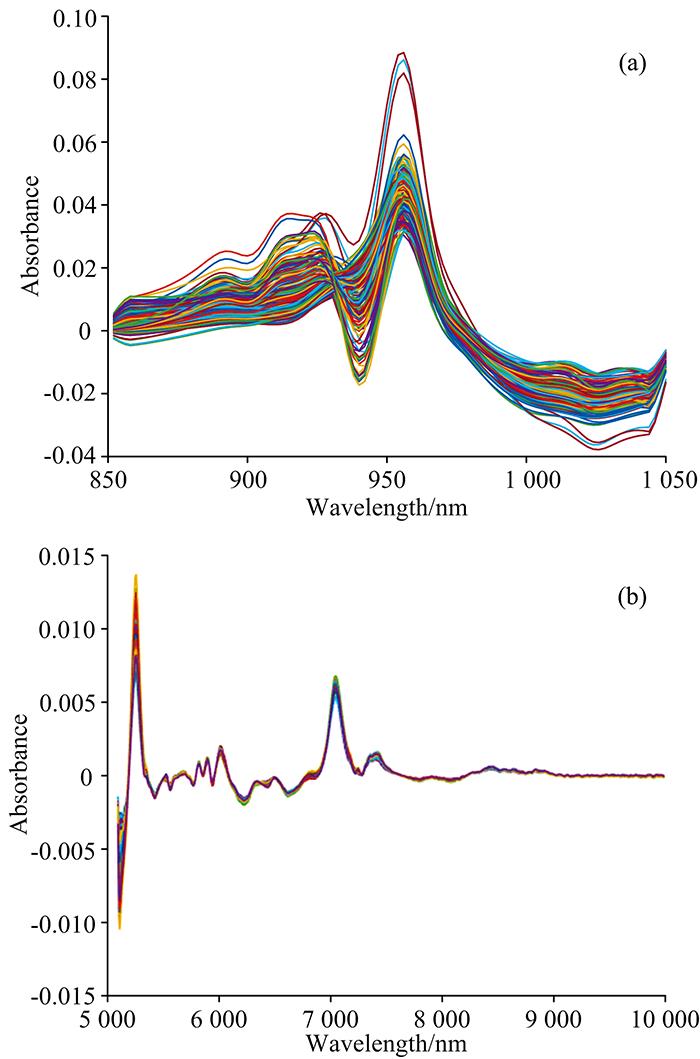
    Fig. 2. The spectra after preprocess
    (a): Tecator dataset; (b): IDRC2018 dataset
    Training loss and test loss of ANN model(a): FCN; (b): GFCN
    Fig. 3. Training loss and test loss of ANN model
    (a): FCN; (b): GFCN
    Influences of the number of groups on the predicting effect of GFCN model
    Fig. 4. Influences of the number of groups on the predicting effect of GFCN model
    Prediction results of three models(a): Fat; (b): Moisture; (c): Protein; (d): IDRC2018
    Fig. 5. Prediction results of three models
    (a): Fat; (b): Moisture; (c): Protein; (d): IDRC2018
    The influence of the size of training set on the predictings effect of three models
    Fig. 6. The influence of the size of training set on the predictings effect of three models
    Contribution ratio of each wavelength of FCN and GFCN models for predicting fat component
    Fig. 7. Contribution ratio of each wavelength of FCN and GFCN models for predicting fat component
    DatasetModelNumber of
    groups
    Number of
    parameters
    TecatorFCN
    GFCN
    /
    5
    5k
    1k
    IDRC2018FCN
    GFCN
    /
    9
    202k
    23k
    Table 1. Number of parameters for FCN and GFCN
    ComponentModelRMSEPR2Note
    PLS2.376 40.967 2PC=11
    fatFCN1.124 50.992 7
    GFCN0.539 60.998 3
    PLS1.969 60.962 2PC=11
    moistureFCN1.734 40.970 7
    GFCN0.579 30.996 7
    PLS0.571 70.961 9PC=13
    proteinFCN0.539 30.968 4
    GFCN0.477 90.975 2
    PLS0.275 70.912 0PC=11
    IDRC2018FCN0.281 20.908 5
    GFCN0.257 30.923 4
    Table 2. Comparison of predictings effects of three models
    Zhi-rong YU, Ming-jian HONG. Near-Infrared Spectral Quantitative Analysis Network Based on Grouped Fully Connection[J]. Spectroscopy and Spectral Analysis, 2022, 42(6): 1735
    Download Citation