• Acta Optica Sinica
  • Vol. 40, Issue 4, 0411002 (2020)
Bo Wei1, Zhiling Yuan1, and Zhilie Tang1、2、*
Author Affiliations
  • 1School of Physics and Telecommunication Engineering, South China Normal University, Guangzhou, Guangdong 510006, China
  • 2National Experimental Teaching Demonstration Center of Basic Course of Physics, South China Normal University, Guangzhou, Guangdong 510006, China
  • show less
    DOI: 10.3788/AOS202040.0411002 Cite this Article Set citation alerts
    Bo Wei, Zhiling Yuan, Zhilie Tang. Three-Dimensional Imaging of Tumor Tissues Based on Photothermal Optical Coherence Tomography[J]. Acta Optica Sinica, 2020, 40(4): 0411002 Copy Citation Text show less
    Experimental setup of PT-OCT
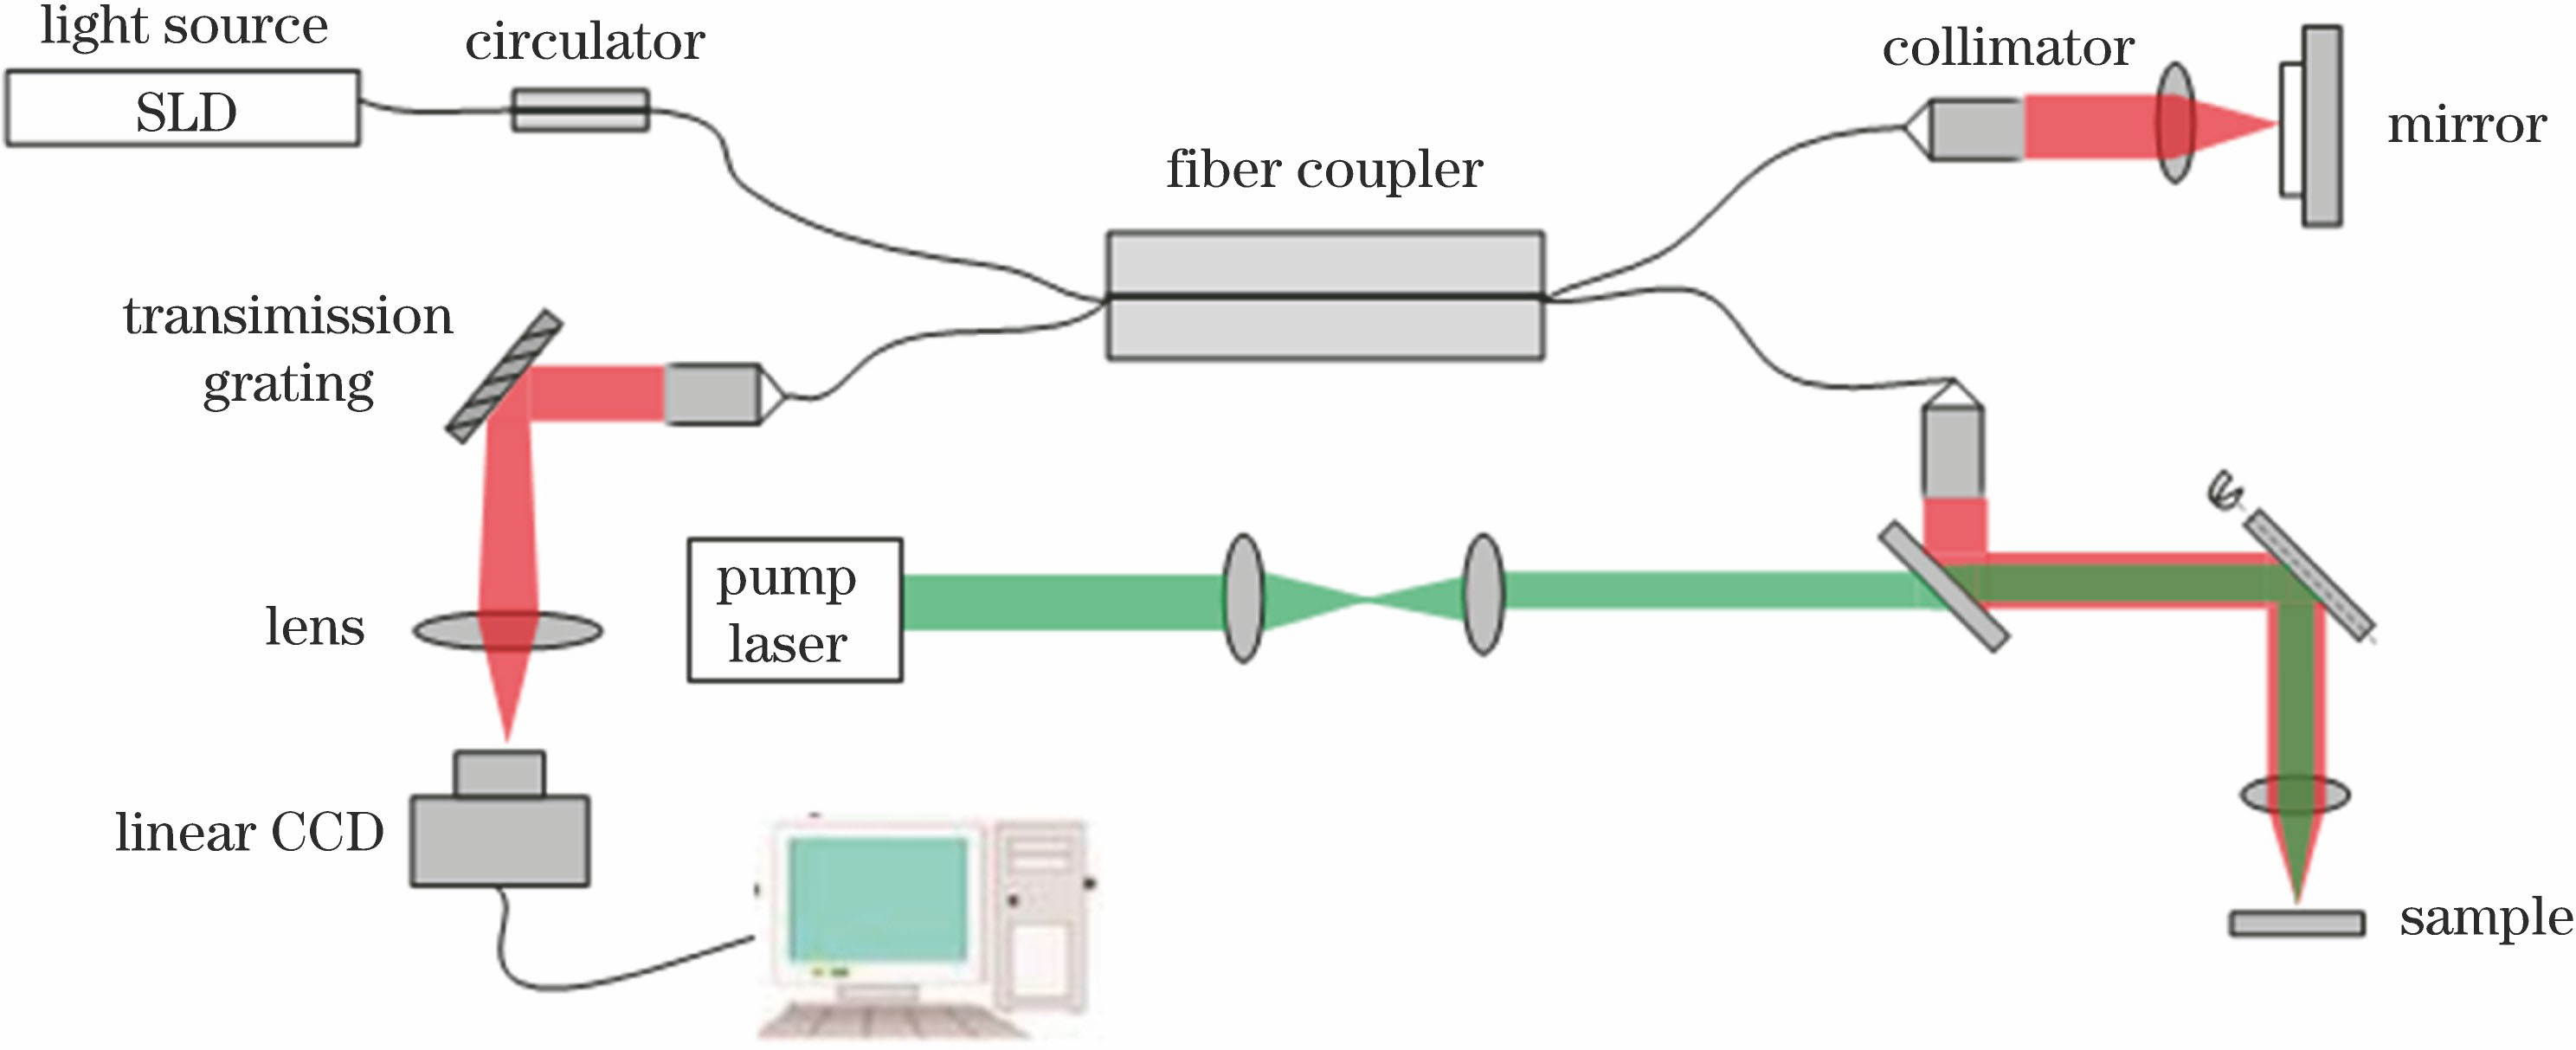
    Fig. 1. Experimental setup of PT-OCT
    Experimental results of imaging phantom. (a) Raw tomogram of OCT; (b) tomogram of PT-OCT obtained by phase difference algorithm; (c) tomogram of PT-OCT obtained by average amplitude algorithm; (d)-(f) gray-level curves corresponding to dashed lines in Fig. 2(a)-(c)
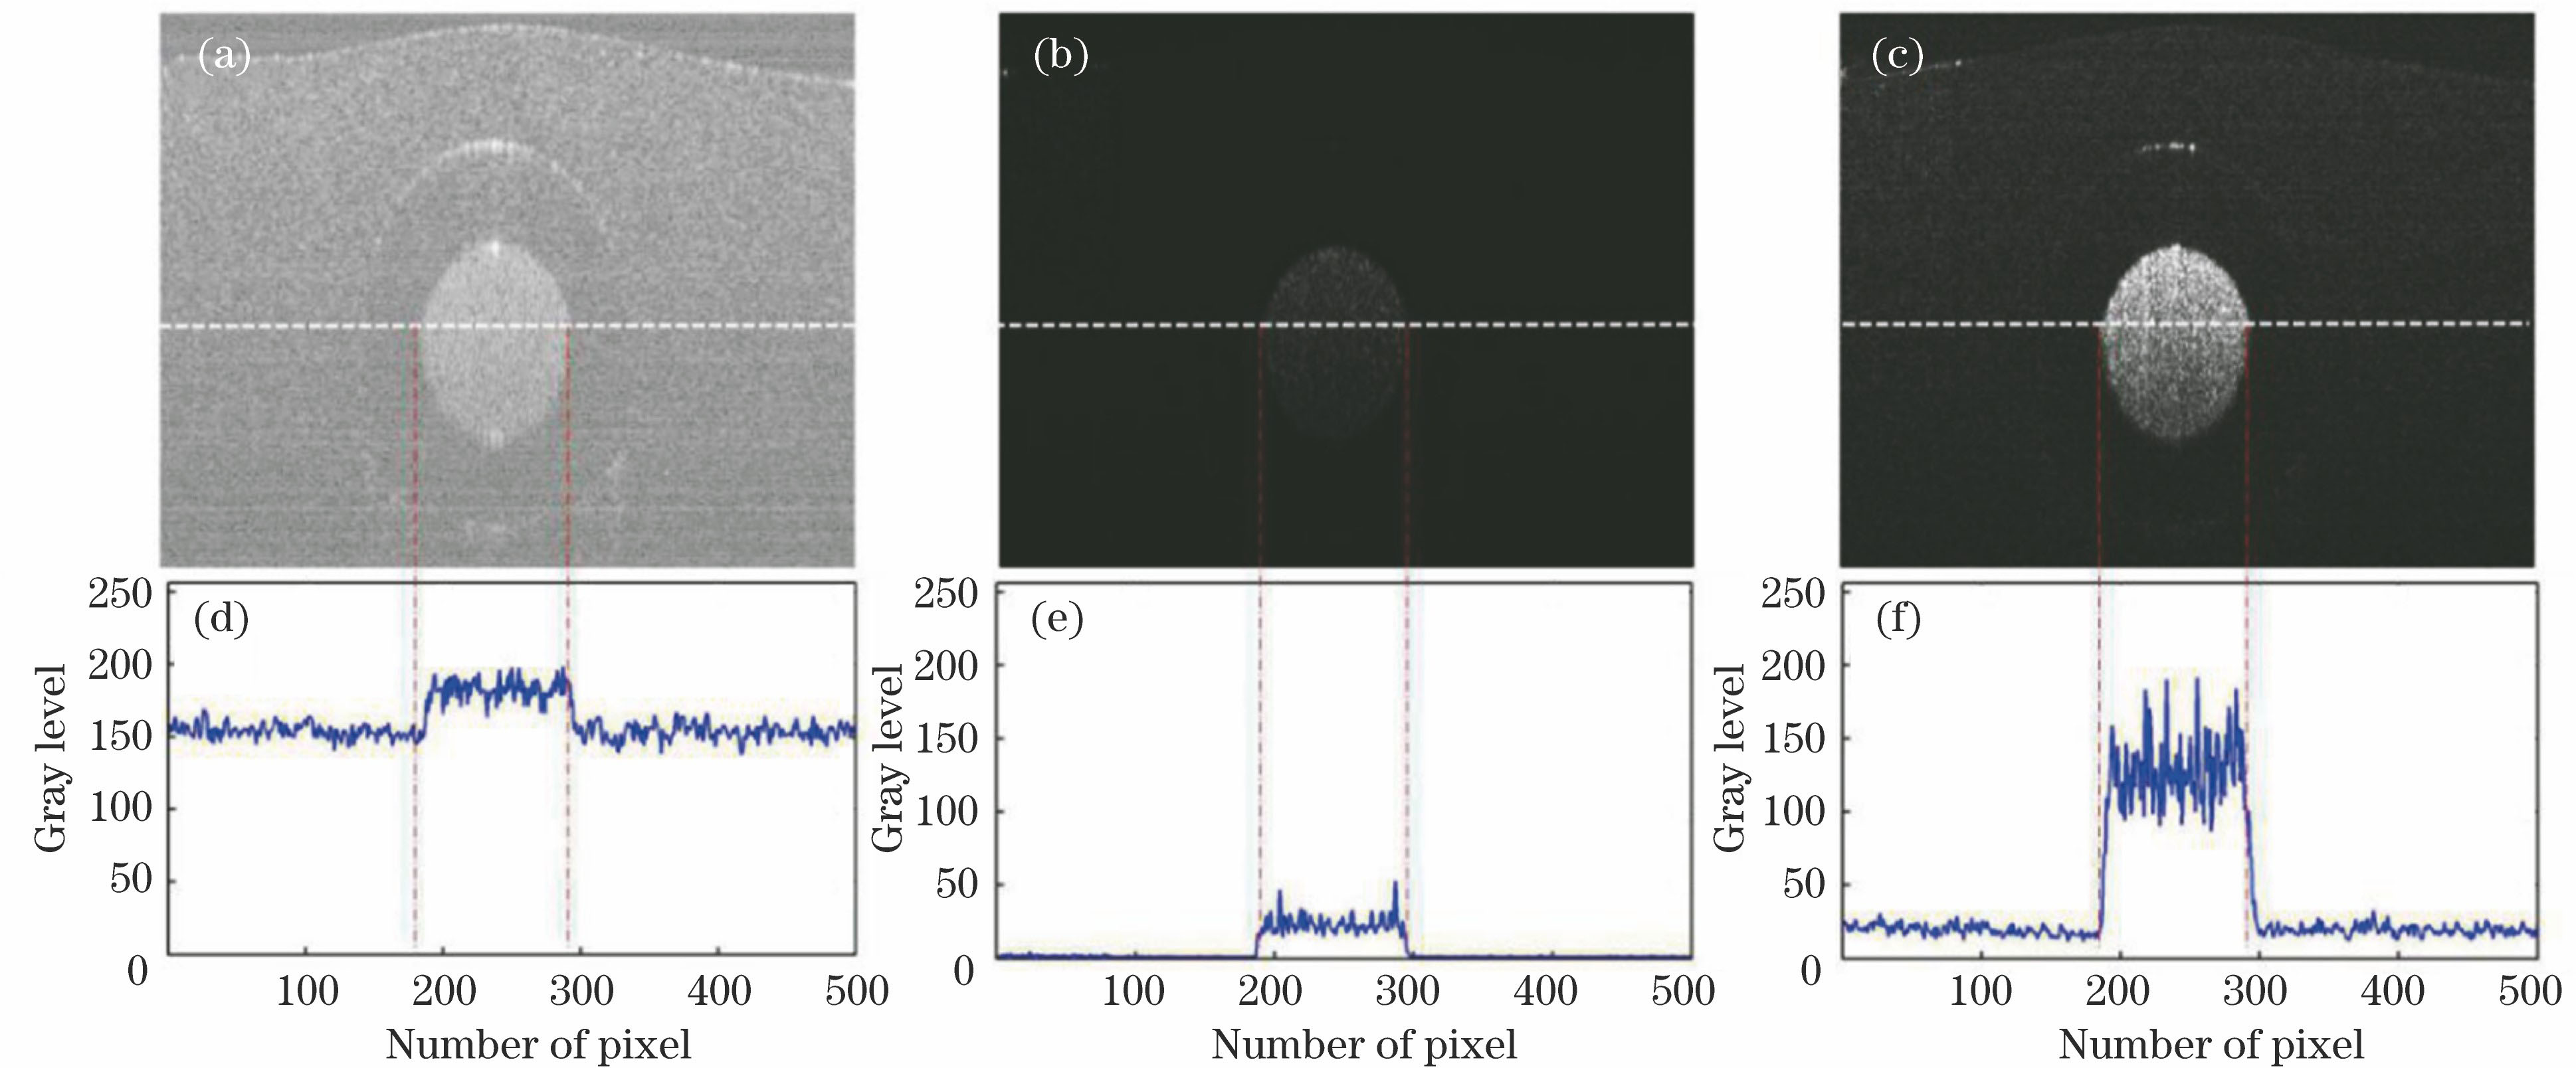
    Fig. 2. Experimental results of imaging phantom. (a) Raw tomogram of OCT; (b) tomogram of PT-OCT obtained by phase difference algorithm; (c) tomogram of PT-OCT obtained by average amplitude algorithm; (d)-(f) gray-level curves corresponding to dashed lines in Fig. 2(a)-(c)
    Experimental results of imaging mouse ear. (a) Three-dimensional image of OCT; (b) three-dimensional top view of OCT; (c) three-dimensional top view of PT-OCT obtained by phase difference algorithm; (d) three-dimensional top view of PT-OCT obtained by average amplitude algorithm
    Fig. 3. Experimental results of imaging mouse ear. (a) Three-dimensional image of OCT; (b) three-dimensional top view of OCT; (c) three-dimensional top view of PT-OCT obtained by phase difference algorithm; (d) three-dimensional top view of PT-OCT obtained by average amplitude algorithm
    Tomograms of mouse ear. (a) Raw tomogram of OCT; (b) tomogram of PT-OCT obtained by phase difference algorithm; (c) tomogram of PT-OCT obtained by average amplitude algorithm; (d)-(f) average values of gray values corresponding to same position in middle of Fig. 4(a)-(c)
    Fig. 4. Tomograms of mouse ear. (a) Raw tomogram of OCT; (b) tomogram of PT-OCT obtained by phase difference algorithm; (c) tomogram of PT-OCT obtained by average amplitude algorithm; (d)-(f) average values of gray values corresponding to same position in middle of Fig. 4(a)-(c)
    Photograph of actual sample using in experiment
    Fig. 5. Photograph of actual sample using in experiment
    PT-OCT images of tumor site. (a) Three-dimensional image of PT-OCT; (b) top view of PT-OCT; (c) side view of PT-OCT marked with pseudo-color photothermal signal; (d) three-dimensional image of PT-OCT marked with pseudo-color photothermal signal
    Fig. 6. PT-OCT images of tumor site. (a) Three-dimensional image of PT-OCT; (b) top view of PT-OCT; (c) side view of PT-OCT marked with pseudo-color photothermal signal; (d) three-dimensional image of PT-OCT marked with pseudo-color photothermal signal
    Specific-depth images of tumor site. (a) Top view of PT-OCT of tumor site; (b)-(i) sectional views at 0.5, 1, 1.5, 2, 2.5, 3, 3.5, and 4 mm from top surface of tumor, respectively
    Fig. 7. Specific-depth images of tumor site. (a) Top view of PT-OCT of tumor site; (b)-(i) sectional views at 0.5, 1, 1.5, 2, 2.5, 3, 3.5, and 4 mm from top surface of tumor, respectively
    Bo Wei, Zhiling Yuan, Zhilie Tang. Three-Dimensional Imaging of Tumor Tissues Based on Photothermal Optical Coherence Tomography[J]. Acta Optica Sinica, 2020, 40(4): 0411002
    Download Citation