• Spectroscopy and Spectral Analysis
  • Vol. 42, Issue 9, 2714 (2022)
Qing-song LIU1、*, You-quan DAN1、1;, Peng YANG2、2;, Luo-peng XU1、1;, Fu-bin YANG1、1;, and Nan DENG1、1;
Author Affiliations
  • 11. School of Science, Civil Aviation Flight University of China, Guanghan 618307, China
  • 22. Joint Laboratory for Ocean Observation and Detection, Pilot National Laboratory for Marine Science and Technology (Qingdao), Qingdao 266200, China
  • show less
    DOI: 10.3964/j.issn.1000-0593(2022)09-2714-06 Cite this Article
    Qing-song LIU, You-quan DAN, Peng YANG, Luo-peng XU, Fu-bin YANG, Nan DENG. Simulation of Emission Spectrum of Abyssal Methane Based on HITRAN Database[J]. Spectroscopy and Spectral Analysis, 2022, 42(9): 2714 Copy Citation Text show less
    Line intensities of four molecules at 5 990~6 150 cm-1(a): CH4; (b): CO2; (c): H2O; (d): H2S
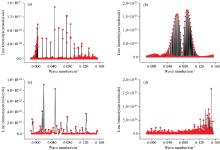
    Fig. 1. Line intensities of four molecules at 5 990~6 150 cm-1
    (a): CH4; (b): CO2; (c): H2O; (d): H2S
    Radiance of 1 653.72 nm line at 670 K and 20 MPa and varying concentration
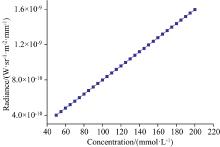
    Fig. 2. Radiance of 1 653.72 nm line at 670 K and 20 MPa and varying concentration
    Radiance of 1 653.72 nm line at 200 mmol·L-1 and 20 MPa and varying temperature
    Fig. 3. Radiance of 1 653.72 nm line at 200 mmol·L-1 and 20 MPa and varying temperature
    Radiance of 1 653.72 nm line at 200 mmol·L-1 and 670 K and varying pressure
    Fig. 4. Radiance of 1 653.72 nm line at 200 mmol·L-1 and 670 K and varying pressure
    Radiances of six effective lines at 670 K and 20 MPa for various concentrations
    Fig. 5. Radiances of six effective lines at 670 K and 20 MPa for various concentrations
    Radiances of six effective lines at 10 mmol·L-1 and 20 MPa for various temperatures
    Fig. 6. Radiances of six effective lines at 10 mmol·L-1 and 20 MPa for various temperatures
    Radiances of six effective lines at 10 mmol·L-1 and 670 K for various pressures
    Fig. 7. Radiances of six effective lines at 10 mmol·L-1 and 670 K for various pressures
    特征波数
    /cm-1
    特征波长
    /nm
    谱线强度
    /(cm2·molecule-1)
    第一组6 046.942 91 653.728 28.325×10⁻²²
    6 046.952 21 653.725 78.325×10⁻²²
    6 046.963 61 653.722 51.486×10⁻²¹
    第二组6 057.079 51 650.960 71.501×10⁻²¹
    6 057.090 81 650.957 68.799×10⁻²²
    6 057.099 61 650.955 25.835×10⁻²²
    6 057.126 91 650.947 78.839×10⁻²²
    第三组6 067.081 01 648.239 18.372×10⁻²²
    6 067.099 11 648.234 28.518×10⁻²²
    6 067.147 01 648.221 15.770×10⁻²²
    6 067.155 81 648.218 88.223×10⁻²²
    第四组6 076.927 21 645.568 54.654×10⁻²²
    6 076.934 11 645.566 67.687×10⁻²²
    6 076.953 11 645.561 51.234×10⁻²¹
    6 077.027 81 645.541 37.467×10⁻²²
    6 077.046 41 645.536 27.118×10⁻²²
    6 077.063 01 645.531 71.219×10⁻²¹
    第五组6 086.744 61 642.914 39.957×10⁻²²
    6 086.779 31 642.905 05.875×10⁻²²
    6 086.798 81 642.899 73.992×10⁻²²
    6 086.830 11 642.891 35.908×10⁻²²
    第六组6 096.168 01 640.374 78.400×10⁻²²
    6 096.177 71 640.372 14.240×10⁻²²
    6 096.179 71 640.371 62.954×10⁻²²
    6 096.372 61 640.319 74.536×10⁻²²
    6 096.423 81 640.305 94.473×10⁻²²
    6 096.484 91 640.289 52.972×10⁻²²
    6 096.501 01 640.285 14.438×10⁻²²
    Table 1. Spectral intensities of six groups lines of methane at 6 040~6 100 cm-1
    Qing-song LIU, You-quan DAN, Peng YANG, Luo-peng XU, Fu-bin YANG, Nan DENG. Simulation of Emission Spectrum of Abyssal Methane Based on HITRAN Database[J]. Spectroscopy and Spectral Analysis, 2022, 42(9): 2714
    Download Citation