
Changsheng Wang, Yunshan Zhang, Jilin Zheng, Jin Li, Zhenxing Sun, Jianqin Shi, Lianyan Li, Rulei Xiao, Tao Fang, Xiangfei Chen. Frequency-modulated continuous-wave dual-frequency LIDAR based on a monolithic integrated two-section DFB laser[J]. Chinese Optics Letters, 2021, 19(11): 111402
- Chinese Optics Letters
- Vol. 19, Issue 11, 111402 (2021)
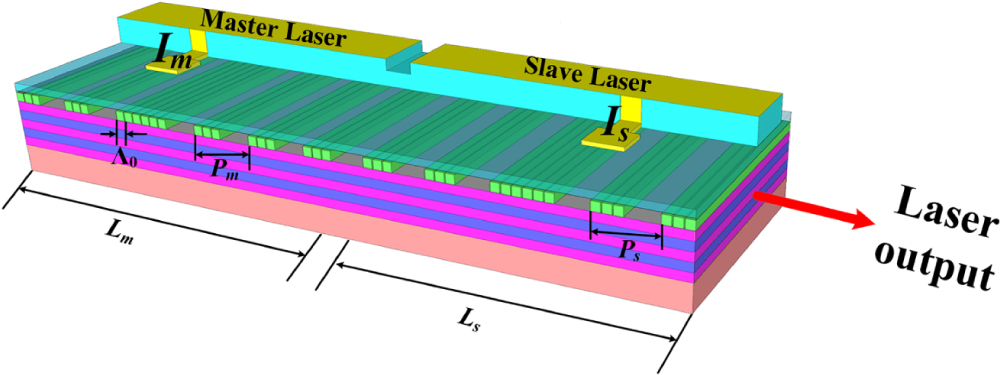
Fig. 1. Schematic of the TS-DFB laser.
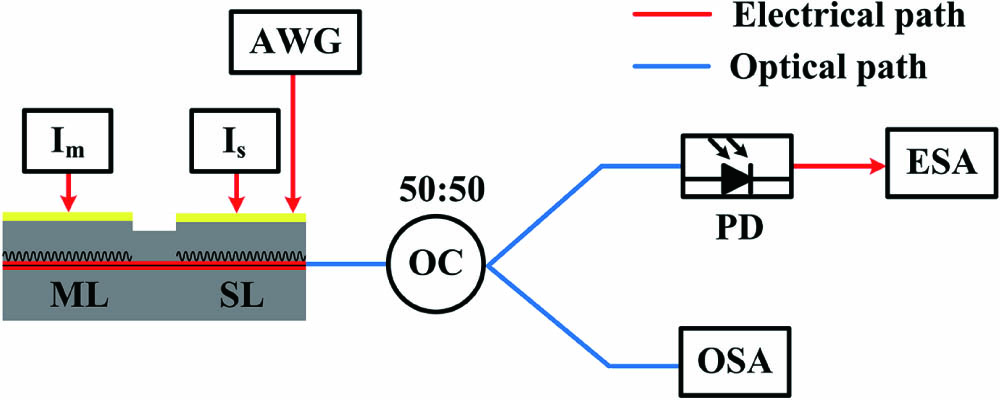
Fig. 2. Experimental setup for laser characteristic measurement. AWG, arbitrary waveform generator; OC, optical coupler; PD, photodetector; ESA, electrical spectrum analyzer; OSA, optical spectrum analyzer.
Fig. 3. (a) Optical spectrum of the TS-DFB laser when Is = 50 mA and Im = 70 mA; (b) optical spectrum when a 7.5 GHz RF signal is applied to the SL.
Fig. 4. Spectra of beat signals for the case of SL with and without RF signal modulation.
Fig. 5. Spectra of the beat signal with the different RF signals.
Fig. 6. Time-frequency curve of (a) the RF signal and (b) the beat signal.
Fig. 7. Experimental setup for the proposed system. AWG, arbitrary waveform generator; OC, optical coupler; EDFA, erbium-doped fiber amplifier; CIR, circulator; DF, delay fiber; PD, photodetector; OSC, oscilloscope; PC, computer.
Fig. 8. Schematics of the time-frequency diagrams of the reference beat signal (blue line), back-reflected beat signal (red line), and the mixing signal (green line).
Fig. 9. Measured time-frequency diagrams of (a) the reference beat signal, (b) the back-reflected beat signal, and (c) the digital mixing signal.
Fig. 10. Spectra of the digital mixing signals for (a) the distance measurement and (b) the velocity measurement.
Fig. 11. Measurement results of the LIDAR. (a1)–(a3) Measured distances and velocities, measurement errors, and REs when target velocity is fixed at 146.3 mm/s with different distances. (b1)–(b3) Measured distances and velocities, measurement errors, and REs when target distance is fixed at 1115 m with various velocities.

Set citation alerts for the article
Please enter your email address
© Copyright 2018-2021 | Chinese Laser Press. All Rights Reserved 沪ICP备15018463号-20