
Changsheng Wang, Yunshan Zhang, Jilin Zheng, Jin Li, Zhenxing Sun, Jianqin Shi, Lianyan Li, Rulei Xiao, Tao Fang, Xiangfei Chen, "Frequency-modulated continuous-wave dual-frequency LIDAR based on a monolithic integrated two-section DFB laser," Chin. Opt. Lett. 19, 111402 (2021)
- Chinese Optics Letters
- Vol. 19, Issue 11, 111402 (2021)
Abstract
Keywords
1. Introduction
High-resolution LIDAR has important applications in scientific research, industrial production, and unmanned driving[
Dual-frequency (DF) LIDAR can effectively weaken the influence of atmospheric turbulence and speckle noise. It can also reduce the difficulty of signal processing compared with the common single-frequency LIDAR[
In this article, an FMCW-DF LIDAR is demonstrated experimentally based on a monolithic integrated two-section (TS) distributed feedback (DFB) laser. The proposed LIDAR can measure the distance and velocity of a target simultaneously. According to the measured results, the maximum relative errors (REs) of the distance and velocity are 1.6% and 3.18%, respectively.
Sign up for Chinese Optics Letters TOC. Get the latest issue of Chinese Optics Letters delivered right to you!Sign up now
2. Characteristics of the Two-Section DFB Laser
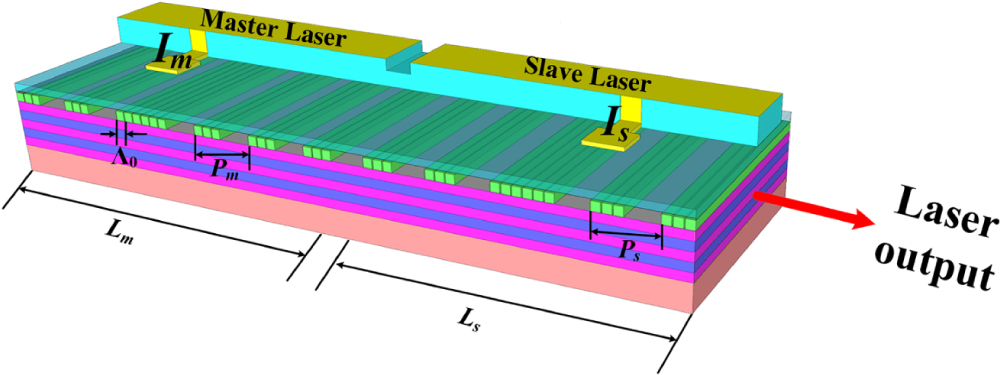
Figure 1 shows the schematic of the monolithic integrated TS-DFB laser utilized in the proposed LIDAR. It consists of two in-series DFB lasers including the master laser (ML) and the slave laser (SL). The cavity lengths of the TSs
![]()
Figure 1.Schematic of the TS-DFB laser.
Through tuning the sampling periods Pm and Ps, the lasing wavelengths of the TSs and detuning frequency can be controlled accurately with deviations less than 0.2 nm[
Figure 2 shows the experimental setup for investigating the performance of the TS-DFB laser. The ML and SL are biased with constant direct current (DC), and the SL is also modulated by a radio frequency (RF) signal generated by an arbitrary waveform generator (AWG). The light from the laser is spilt into two beams by an optical coupler (OC). One beam is injected into a high-speed photodetector (PD) to observe the performance of the beat signal. The optical spectrum analyzer (OSA) is used to monitor the optical spectrum simultaneously. Figure 3(a) shows the optical spectra of the TS-DFB laser without RF modulation signal when the bias currents (
![]()
Figure 2.Experimental setup for laser characteristic measurement. AWG, arbitrary waveform generator; OC, optical coupler; PD, photodetector; ESA, electrical spectrum analyzer; OSA, optical spectrum analyzer.
![]()
Figure 3.(a) Optical spectrum of the TS-DFB laser when Is = 50 mA and Im = 70 mA; (b) optical spectrum when a 7.5 GHz RF signal is applied to the SL.
![]()
Figure 4.Spectra of beat signals for the case of SL with and without RF signal modulation.
It is found that the ML frequency varies with the frequency of the
![]()
Figure 5.Spectra of the beat signal with the different RF signals.
![]()
Figure 6.Time-frequency curve of (a) the RF signal and (b) the beat signal.
3. Experimental Setup and Theory Principle
Figure 7 shows experiment setup of the proposed FMCW-DF LIDAR. The LFM DF TS-DFB laser discussed above is utilized. The SL is modulated by the LFM RF signal shown in Fig. 6(a). The light from the laser is split into two beams by a 50:50 OC. The first beam is directed into a high-speed photodetector (PD2) as the reference signal. The second beam is amplified by an erbium-doped fiber amplifier (EDFA), sent to port-1 of a circulator, and then transmitted through a delay fiber and collimator in port-2 to the moving target. The back-reflected light from the target with Doppler shift is coupled to the circulator by the same delay fiber and collimator. It should be noted that the moving target is a mirror on a motorized translation stage, the target velocity is controlled by the translation stage, and target distance here is defined by the length of the delay fiber, so we can replace the distance of the target in space by using delayed fiber of different lengths. The back-reflected light is injected to another high-speed photodetector (PD1) through port-3 of the circulator. The electrical signals from PD1 and PD2 are acquired by a real-time oscilloscope (OSC). Then, the signals are digital frequency mixed and analyzed by a computer.
![]()
Figure 7.Experimental setup for the proposed system. AWG, arbitrary waveform generator; OC, optical coupler; EDFA, erbium-doped fiber amplifier; CIR, circulator; DF, delay fiber; PD, photodetector; OSC, oscilloscope; PC, computer.
Figure 8 shows the schematic of the time-frequency domain diagrams of the reference beat signal, back-reflected beat signal, and mixing signal of the two signals. The frequency of the reference beat signal can be expressed as
![]()
Figure 8.Schematics of the time-frequency diagrams of the reference beat signal (blue line), back-reflected beat signal (red line), and the mixing signal (green line).
Here,
After frequency mixing and lowpass filtering, three low-frequency components can be obtained from the mixing signal, which is shown in Eq. (3):
The distance and velocity of the moving target can be simultaneously derived as
4. Experimental Results
Figure 9 shows the measured time-frequency diagrams of the reference beat signal, back-reflected beat signal, and digital mixing signal when the distance and velocity are set at 2935 m and 0.51 m/s, respectively. It can be seen that the Doppler shift difference
![]()
Figure 9.Measured time-frequency diagrams of (a) the reference beat signal, (b) the back-reflected beat signal, and (c) the digital mixing signal.
To obtain more precise results, the fast Fourier transform (FFT) method is used to process the signals. Figure 10 presents the spectra of the digital mixing signals for the measurements of distance and velocity of the target. According to Eq. (4), the measured distance and velocity are 2938.71 m and 0.505 m/s, which agree well with the set value.
![]()
Figure 10.Spectra of the digital mixing signals for (a) the distance measurement and (b) the velocity measurement.
To investigate the performance of the FMCW-DF LIDAR, targets with various distances and velocities are measured, and the measurement errors and REs are also demonstrated. Figure 11(a1) shows the distance and velocity measurement results when the distance is changed from 15 m to 2935 m with a fixed speed of 146.3 mm/s. Figures 11(a2) and 11(a3) show the distance and velocity measurement errors and REs at different target distances. The maximum distance measurement error is 4.63 m when the target distance is set at 1 km. The maximum velocity measurement error is 0.00132 m/s. The maximum REs of the distance and velocity measurements are 1.6% and 0.9%, respectively. Figure 11(b1) illustrates the distance and velocity measurement results when the speed of the target varies from 7.3 mm/s to 1462.5 mm/s with a fixed distance of 1115 m. In this case, the maximum distance error and velocity error are 4.63 m and 0.00349 m/s, respectively. The REs of the distance and velocity measurement are 0.14% and 3.18%.
![]()
Figure 11.Measurement results of the LIDAR. (a1)–(a3) Measured distances and velocities, measurement errors, and REs when target velocity is fixed at 146.3 mm/s with different distances. (b1)–(b3) Measured distances and velocities, measurement errors, and REs when target distance is fixed at 1115 m with various velocities.
5. Conclusion
An FMCW-DF LIDAR based on a monolithic integrated TS-DFB laser is experimentally demonstrated. Utilizing the sideband injection locking technique, the DF TS-DFB laser with high-quality LFM beat signal is realized, which is employed in the proposed LIDAR. The performance of the LIDAR is also experimentally investigated. The FMCW-DF LIDAR can accurately measure the distance and velocity of a target simultaneously. The maximum relative measurement errors of the distance and velocity are 1.6% and 3.18%, respectively.
References
[1] R. H. Couch, C. W. Rowland, K. S. Ellis, M. P. Blythe, C. R. Regan, M. R. Koch, C. W. Antill, W. L. Kitchen, J. W. Cox, J. F. DeLorme, S. K. Crockett, R. G. Remus, J. C. Casas, W. H. Hunt. Lidar in-space technology experiment (LITE): NASA’s first in-space lidar system for atmospheric research. Opt. Eng., 30, 88(1991).
[2] B. Schwarz. Lidar: mapping the world in 3D. Nat. Photon., 4, 429(2010).
[3] R. Diaz, S.-C. Chan, J.-M. Liu. Lidar detection using a dual-frequency source. Opt. Lett., 31, 3600(2006).
[4] R. H. Rasshofer, K. Gresser. Automotive radar and lidar systems for next generation driver assistance functions. Adv. Radio Sci., 3, 205(2005).
[5] J. Lee, Y. J. Kim, K. Lee, S. Lee, S. W. Kim. Time-of-flight measurement with femtosecond light pulses. Nat. Photon., 4, 716(2010).
[6] S. Guang, W. Wen. Dual interferometry FMCW laser ranging for high precision absolute distance measurement system. Infrared Laser Eng., 45, 806001(2016).
[7] Y. Li, Y. Cai, R. Li, H. Shi, H. Tian, M. He, Y. Song, M. Hu. Large-scale absolute distance measurement with dual free-running all-polarization-maintaining femtosecond fiber lasers. Chin. Opt. Lett., 17, 091202(2019).
[8] Z. Lu, W. Lu, Y. Zhou, J. Sun, Q. Xu, L. Wang. Three-dimensional coherent ladar based on FMCW and its flight demonstration. Chin. Opt. Lett., 17, 092801(2019).
[9] U. Sharma, G. Chen, J. U. Kang, I. Ilev, R. W. Waynant. Fiber optic confocal laser Doppler velocimeter using an all-fiber laser source for high resolution measurements. Opt. Express, 13, 6250(2005).
[10] C. H. Cheng, J. W. Lee, T. W. Lin, F. Y. Lin. Dual-frequency laser doppler velocimeter for speckle noise reduction. Opt. InfoBase Conf. Pap., 20, 4914(2012).
[11] J. T. Dobler, B. M. Gentry, J. A. Reagan. Dual-frequency technique for Doppler wind lidar measurements. Proc. SPIE, 4484, 82(2002).
[12] H. Zhu, J. Chen, D. Guo, W. Xia, H. Hao, M. Wang. Birefringent dual-frequency laser Doppler velocimeter using a low-frequency lock-in amplifier technique for high-resolution measurements. Appl. Opt., 55, 4423(2016).
[13] H. K. Sung, T. Jung, M. C. Wu, D. Tishinin, K. Y. Liou, W. T. Tsang16th Annual Meeting of the IEEE Lasers and Electro-Optics Society. Optical generation of millimeter-waves using monolithic sideband injection locking of a two-section DFB laser, 1005(2003).
[14] Y. Shi, X. Chen, Y. Zhou, S. Li, L. Lu, R. Liu, Y. Feng. Experimental demonstration of eight-wavelength distributed feedback semiconductor laser array using equivalent phase shift. Opt. Lett., 37, 3315(2012).
[15] Y. Zhang, L. Li, Y. Zhou, G. Zhao, Y. Shi, J. Zheng, Z. Zhang, Y. Liu, L. Zou, Y. Zhou, Y. Du, X. Chen. Modulation properties enhancement in a monolithic integrated two-section DFB laser utilizing side-mode injection locking method. Opt. Express, 25, 27595(2017).
[16] Y. Dai, X. Chen. DFB semiconductor lasers based on reconstruction-equivalent-chirp technology. Opt. Express, 15, 2348(2007).
[17] J. Lu, S. Liu, Q. Tang, H. Xu, Y. Chen, X. Chen. Multi-wavelength distributed feedback laser array with very high wavelength-spacing precision. Opt. Lett., 40, 5136(2015).
[18] J. M. Liu, T. B. Simpson. Four-wave mixing and optical modulation in a semiconductor laser. IEEE J. Quantum Electron., 30, 957(1994).


Set citation alerts for the article
Please enter your email address

© Copyright 2018-2021 | Chinese Laser Press. All Rights Reserved 沪ICP备15018463号-20