
Jingfang Cai, Hao Zhou, Ying Yan, Min Wang, Yijing Tang, Ying Yu, Laiming Wu, Lankun Cai. Study on Threshold Value of Laser Cleaning Loose Surface Green Rust Bronzes[J]. Laser & Optoelectronics Progress, 2022, 59(11): 1114005
- Laser & Optoelectronics Progress
- Vol. 59, Issue 11, 1114005 (2022)
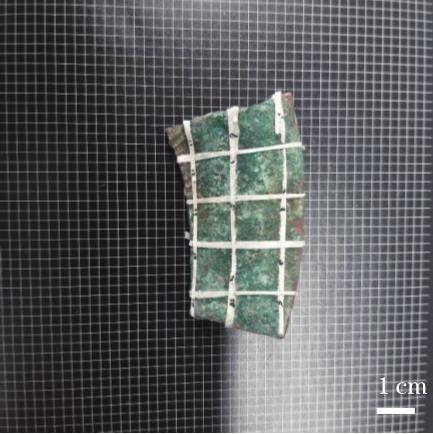
Fig. 1. Bronze sample for experiment
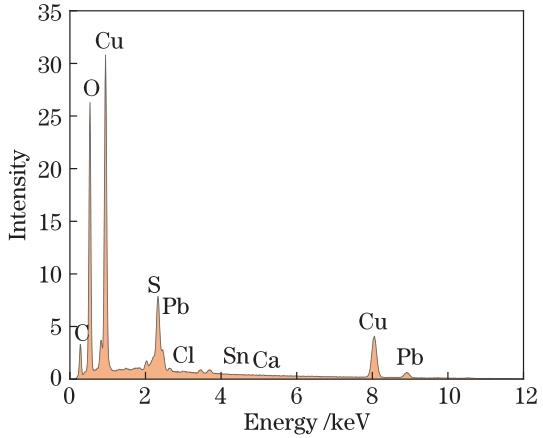
Fig. 2. EDS spectrum of surface before cleaning
Fig. 3. Morphology comparison before and after dry LQS cleaning
Fig. 4. Raman characterization of dry LQS cleaning process
Fig. 5. Morphology comparison before and after dry SFR cleaning. (a) Morphology comparison before and after cleaning; (b) ablation area
Fig. 6. EDS spectra after dry cleaning under different pulse modes. (a) LQS; (b) SFR
Fig. 7. Morphology comparison before and after wet LQS cleaning
Fig. 8. Raman characterization of wet LQS cleaning process
Fig. 9. Morphology comparison before and after wet SFR cleaning
Fig. 10. Raman characterization of wet SFR cleaning process
Fig. 11. EDS spectra after wet cleaning under different pulse modes. (a) LQS; (b) SFR
Fig. 12. Morphology comparison of agar gel before and after LQS cleaning
Fig. 13. Raman characterization of LQS cleaning process of agar gel
Fig. 14. Morphology comparison of agar gel before and after SFR cleaning
Fig. 15. Raman characterization of SFR cleaning process of agar gel
Fig. 16. EDS spectra of agar gel after cleaning under different pulse modes. (a) LQS; (b) SFR
|
Table 1. Element contents before cleaning
|
Table 2. Element contents after dry cleaning (atomic fraction,%)
|
Table 3. Element contents after wet cleaning (atomic fraction, %)
|
Table 4. Element contents of agar gel after cleaning (atomic fraction, %)

Set citation alerts for the article
Please enter your email address
© Copyright 2018-2021 | Chinese Laser Press. All Rights Reserved 沪ICP备15018463号-20