
Hai-ming ZHENG, Xiao-peng ZHU, Shuai-shuai FENG, Gui-hong JIA. Experimental Research on Monitoring of BTX Concentration Based on Differential Optical Absorption Spectroscopy[J]. Spectroscopy and Spectral Analysis, 2021, 41(2): 467
- Spectroscopy and Spectral Analysis
- Vol. 41, Issue 2, 467 (2021)
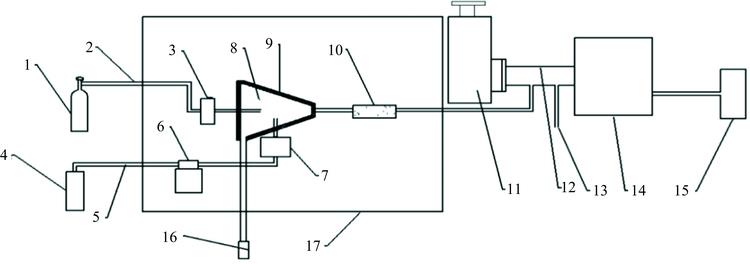
Fig. 1. Experimental system
1: Nitrogen source; 2: PTFE tube; 3: CS200 flow control valve; 4: BTX standard fluid; 5: Silicone hose; 6: BT100-2J precision peristaltic pump; 7: Atomizer; 8: Mixing gas chamber; 9: Heating device; 10: Filter; 11: Ultraviolet enhanced xenon light source; 12: Absorption cell; 13: Exhaust gas outflow end; 14: Data acquisition system; 15: PC data processing system; 16: Waste liquid recovery tank; 17:Shell
1: Nitrogen source; 2: PTFE tube; 3: CS200 flow control valve; 4: BTX standard fluid; 5: Silicone hose; 6: BT100-2J precision peristaltic pump; 7: Atomizer; 8: Mixing gas chamber; 9: Heating device; 10: Filter; 11: Ultraviolet enhanced xenon light source; 12: Absorption cell; 13: Exhaust gas outflow end; 14: Data acquisition system; 15: PC data processing system; 16: Waste liquid recovery tank; 17:Shell
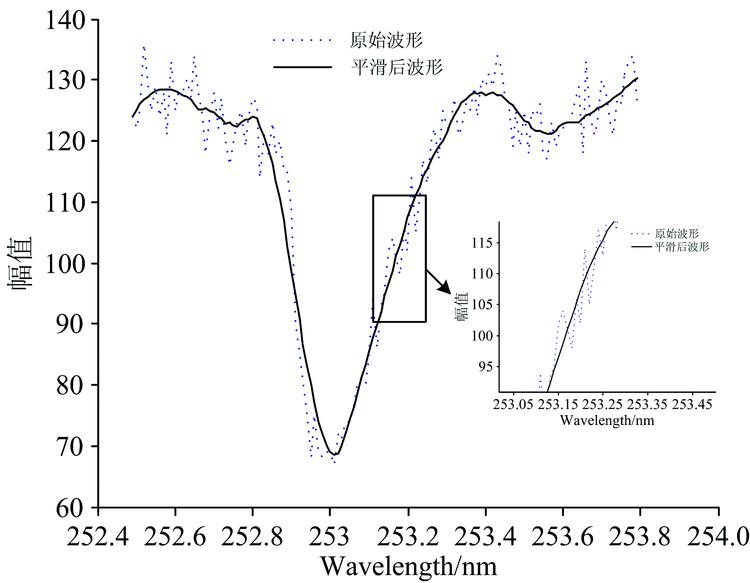
Fig. 2. Schematic of smooth denoising
Fig. 3. Schematic of Wavelet transform denoising
Fig. 4. Comparison of benzene absorption cross-section
Fig. 5. Comparison of filtering effect
Fig. 6. Absorbance of gaseous benzene
Fig. 7. Benzene fitting curve
Fig. 8. Differential absorbance curve of benzene
Fig. 9. BTX mixed concentration inversion process
(a): BTX differential absorbance; (b): BTX differential absorbance and xylene differential absorbance;(c): Differential absorbance of benzene and toluene; (d) Differential absorbance of benzene
(a): BTX differential absorbance; (b): BTX differential absorbance and xylene differential absorbance;(c): Differential absorbance of benzene and toluene; (d) Differential absorbance of benzene
|
Table 1. Inversion results of gaseous benzene based on integrated area method and least square method
|
Table 2. BTX mixed gas ratio (mg·m-3)
| ||||||||||||||||||||||||||||||||||||||||||||||||||||||||||||||||||||||||||||||||
Table 3. Inversion results of different concentrations mixed gases (mg·m-3)

Set citation alerts for the article
Please enter your email address
© Copyright 2018-2021 | Chinese Laser Press. All Rights Reserved 沪ICP备15018463号-20