• Laser & Optoelectronics Progress
  • Vol. 55, Issue 5, 051006 (2018)
Guang Miao1、1; and Chaofeng Li1、2;
Author Affiliations
  • 1 Key Laboratory of Advanced Process Control for Light Industry, Jiangnan University, Wuxi, Jiangsu 214122, China
  • 1 School of Internet of Things Engineering, Jiangnan University, Wuxi, Jiangsu 214122, China
  • show less
    DOI: 10.3788/LOP55.051006 Cite this Article Set citation alerts
    Guang Miao, Chaofeng Li. Detection of Pulmonary Nodules CT Images Combined with Two-Dimensional and Three-Dimensional Convolution Neural Networks[J]. Laser & Optoelectronics Progress, 2018, 55(5): 051006 Copy Citation Text show less
    Flow chart of lung nodule detection system
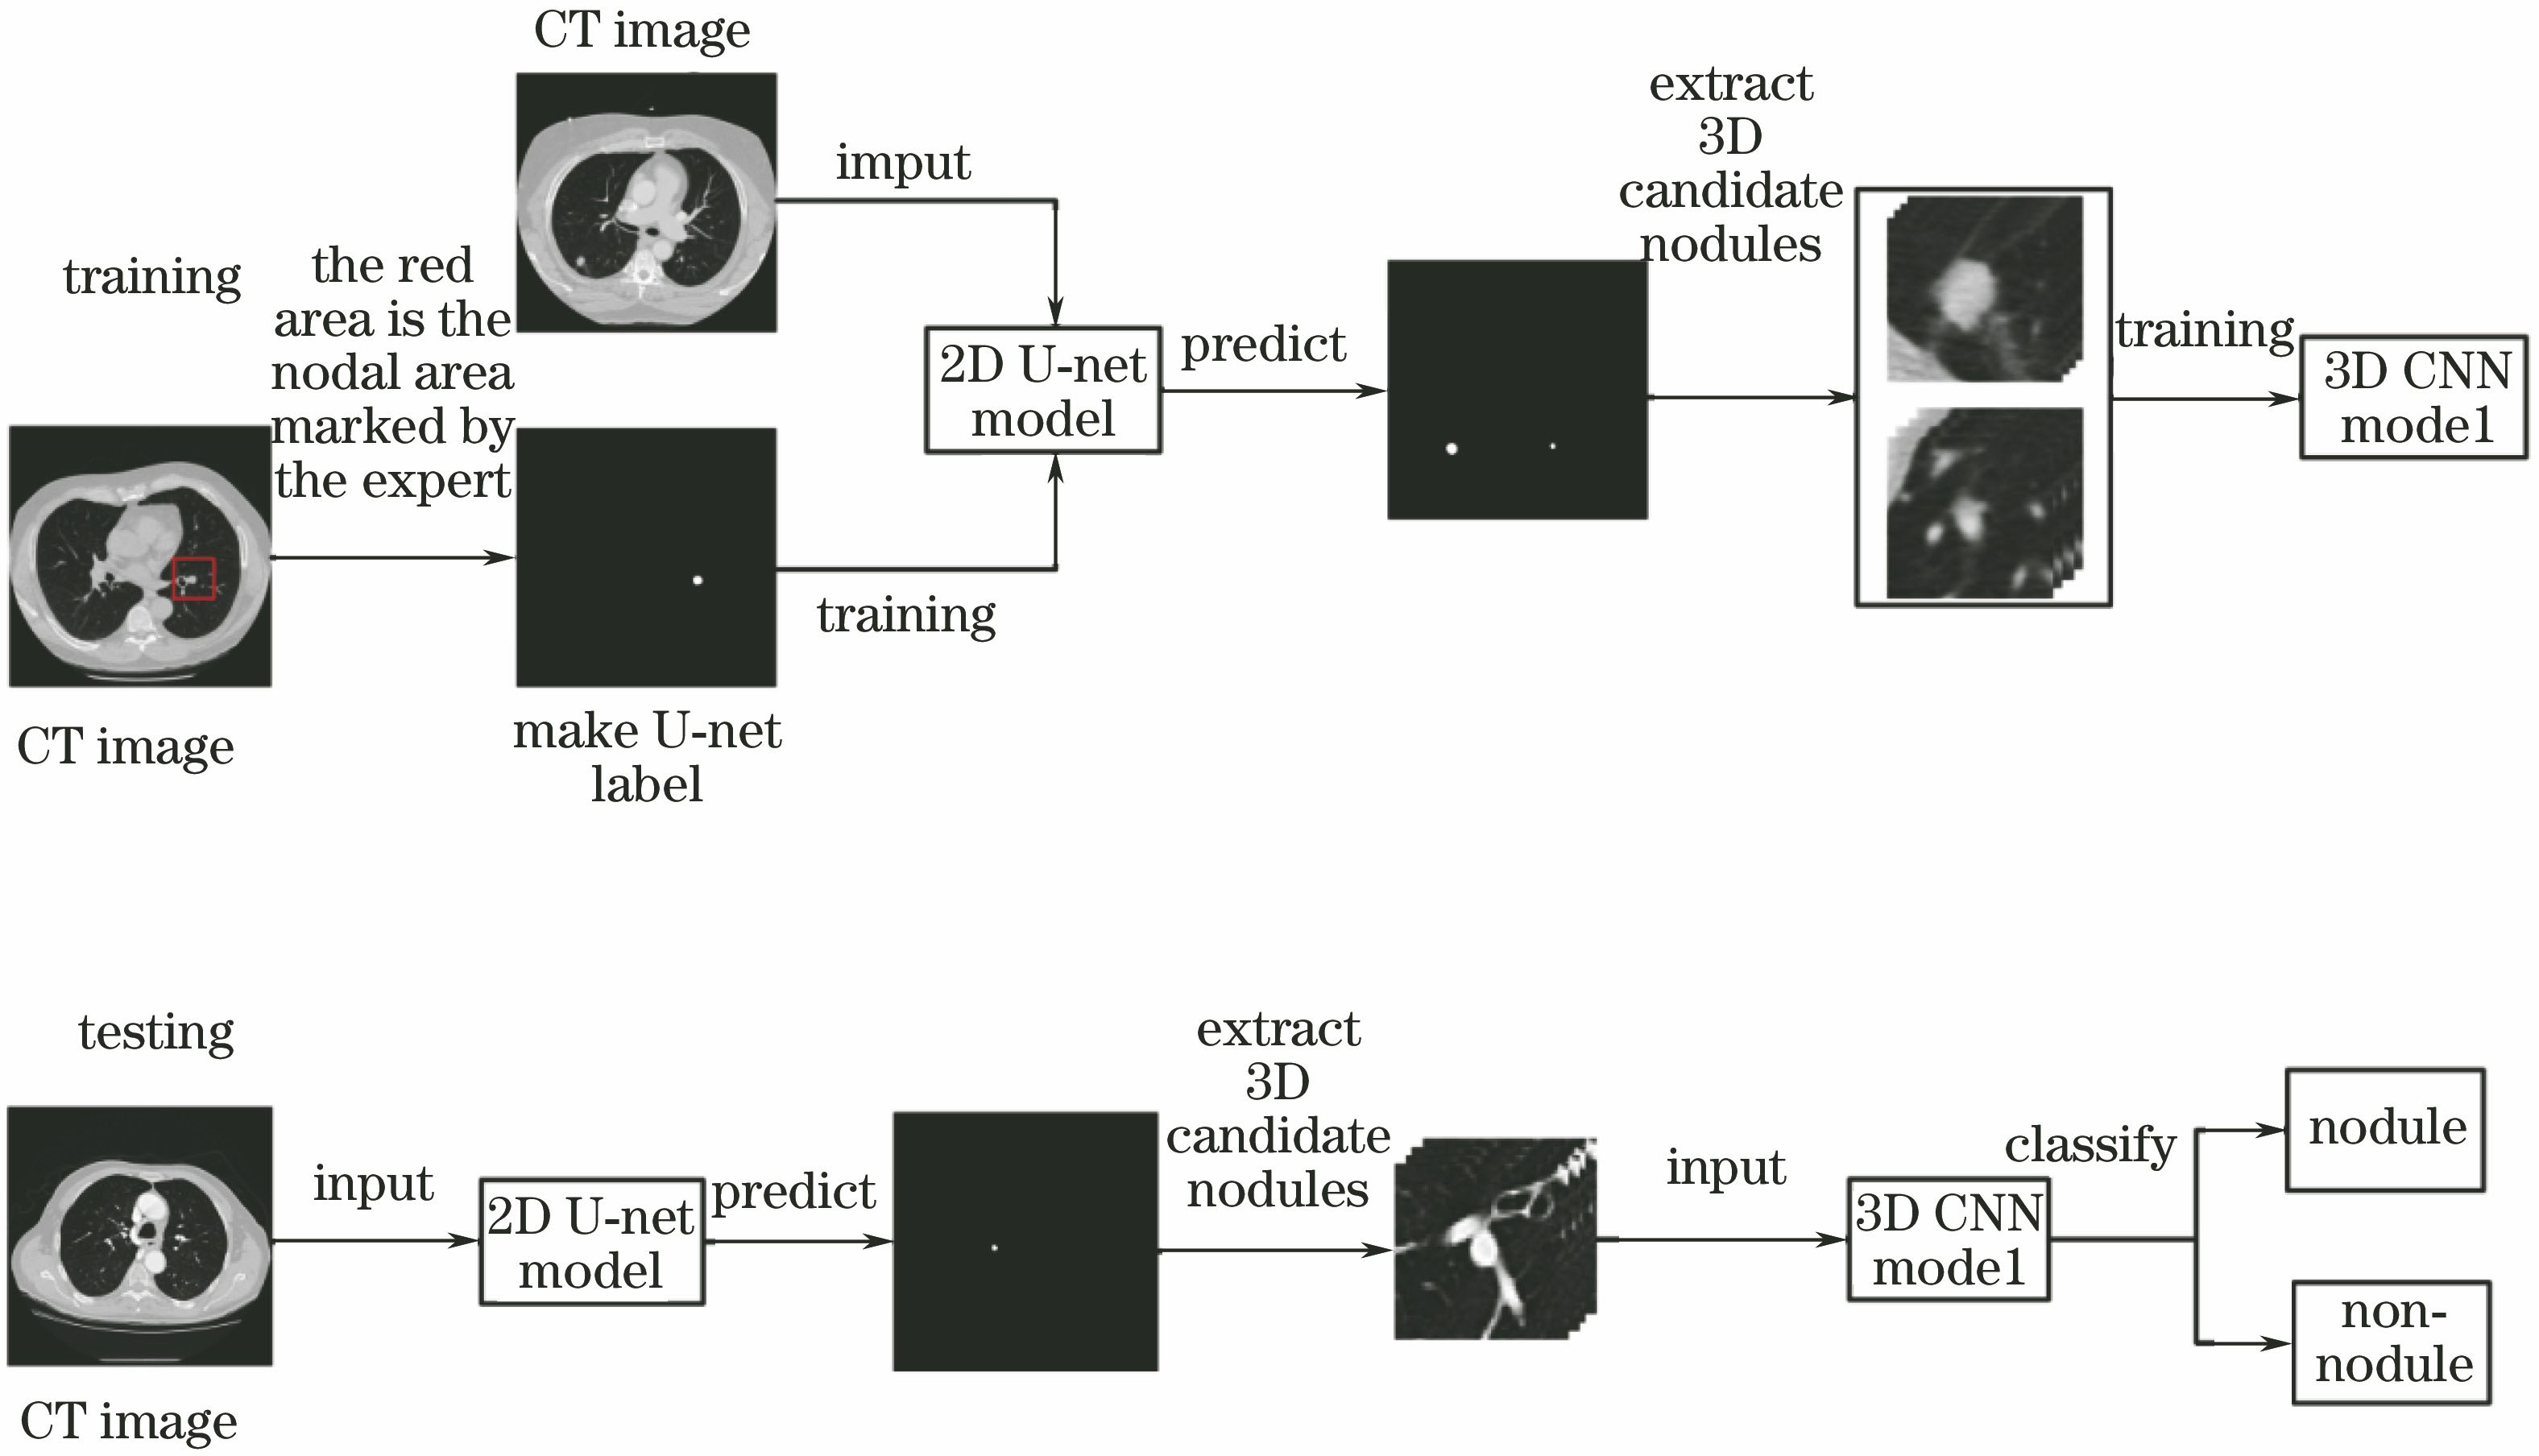
    Fig. 1. Flow chart of lung nodule detection system
    CT slice original images and U-net prediction images. (a) Original images; (b) prediction images
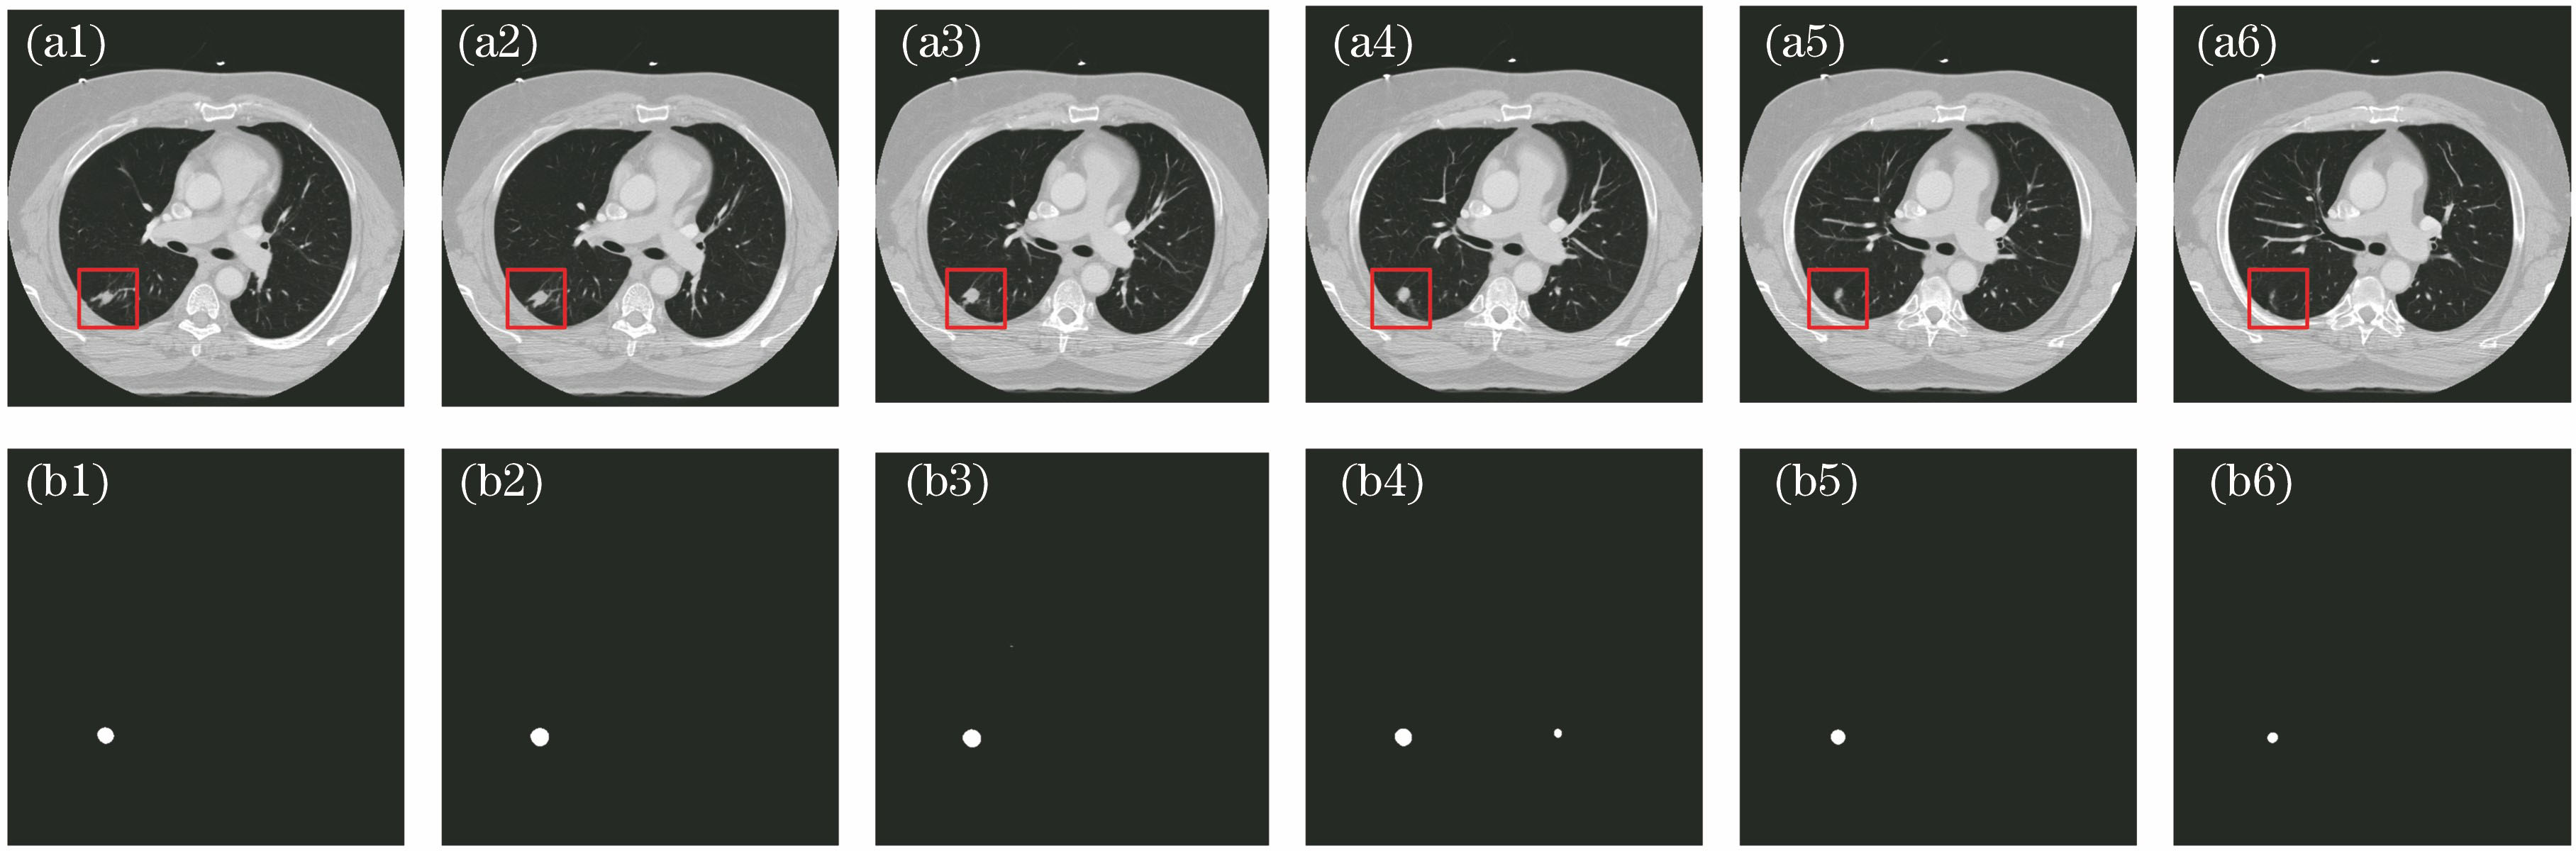
    Fig. 2. CT slice original images and U-net prediction images. (a) Original images; (b) prediction images
    Structure of 3D convolution neural network false positive removal system network
    Fig. 3. Structure of 3D convolution neural network false positive removal system network
    Number distribution of nodules with different sizes
    Fig. 4. Number distribution of nodules with different sizes
    Images of nodules with different sizes in the database. (a) Small nodules; (b) middle nodules; (c) big nodules
    Fig. 5. Images of nodules with different sizes in the database. (a) Small nodules; (b) middle nodules; (c) big nodules
    Training error and test accuracy curves of 3D convolution neural network model
    Fig. 6. Training error and test accuracy curves of 3D convolution neural network model
    Accuracy of average number of false positives per CT image
    Fig. 7. Accuracy of average number of false positives per CT image
    Effect of the dimensions of the input image block on the experimental results
    Fig. 8. Effect of the dimensions of the input image block on the experimental results
    Effect of the selection of network model on experimental results
    Fig. 9. Effect of the selection of network model on experimental results
    False negative nodules
    Fig. 10. False negative nodules
    CAD systemsYearNumber of casesNodules size /mmNodule number(Sensitivity /%) /(FPs /a.u.)
    Proposed method-888≥3118687.3/1.097.0/4.0
    Literature [12]2016888≥3118684.4/1.090.5/4.0
    Literature [13]2015888≥3118673.0/1.076.0/4.0
    Literature [20]2015949≥3174980.0/8.0
    Literature [18]2014108≥46875.0/2.0
    Literature [19]2013583-3015195.3/2.3
    Literature [25]201284≥314897.0/6.188/2.5
    Table 1. Comparison of detection algorithms of pulmonary nodules in LIDC-IDRI database
    Guang Miao, Chaofeng Li. Detection of Pulmonary Nodules CT Images Combined with Two-Dimensional and Three-Dimensional Convolution Neural Networks[J]. Laser & Optoelectronics Progress, 2018, 55(5): 051006
    Download Citation