
Ziqi Luo, Changyu Wang, Zhao Wang, Fubing Lin, Jinzhong Lu, Kaiyu Luo. Microstructure Evolution and Wear Resistance Enhancement of H13 Steel Powder Repaired 45 Steel Using Laser Composite Remanufacturing[J]. Chinese Journal of Lasers, 2024, 51(16): 1602202
- Chinese Journal of Lasers
- Vol. 51, Issue 16, 1602202 (2024)
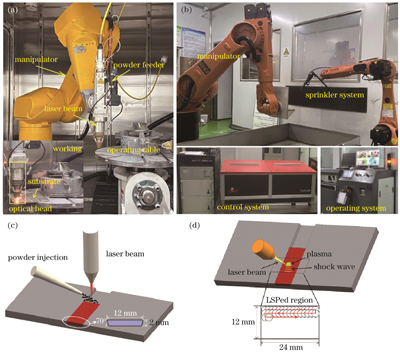
Fig. 1. Diagrams of laser composite remanufacturing process. (a) Photo of LDED equipment; (b) photo of LSP equipment; (c) schematic diagram of LDED; (d) schematic diagram of LSP
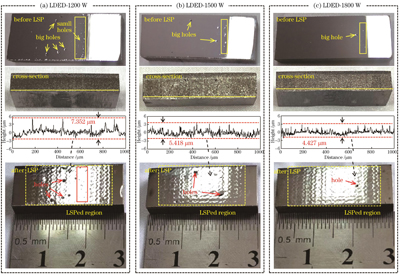
Fig. 2. Morphology of LDED repaired samples before and after LSP. (a) LDED-1200 W+LSP sample; (b) LDED-1500 W+LSP sample; (c) LDED-1800 W+LSP sample
Fig. 3. Surface residual stress distribution of LDED and LDED+LSP repaired samples
Fig. 4. Surface microhardness of LDED and LDED+LSP repaired samples
Fig. 5. XRD spectra and their magnification of LDED and LDED+LSP repaired samples
Fig. 6. EBSD diagrams of cross-section of LDED and LDED+LSP repaired samples. (a) LDED-1200 W sample; (b) LDED-1200 W+LSP sample; (c) LDED-1500 W sample; (d) LDED-1500 W+LSP sample; (e) LDED-1800 W sample; (f) LDED-1800 W+LSP sample; (g) magnified microstructure of LDED sample; (h) magnified microstructure of LDED+LSP sample
Fig. 7. Typical TEM images of LDED repaired samples. (a) LDED-1200 W sample; (b) LDED-1800 W sample; (c1) high magnification of fine needle-like tissue shown in the square area of LDED-1200 W sample TEM image; (c2)‒(c4) fine needle-like tissue image captured by electron microscopy and EDS analysis of major elements of the fine needle-like tissue
Fig. 8. Typical TEM images of the LSPed surface layer of LDED+LSP repaired samples. (a) Cross-sectional image along the depth direction; (b1) nanograins; (b2) dark-field (DF) image of nanograins; (c1)‒(c2) dislocation tangles (DTs) and dislocation cells (DCs)
Fig. 9. Friction coefficient curves of LDED and LDED+LSP repaired samples
Fig. 10. Confocal scan images of wear surface of LDED and LDED+LSP repaired samples. (a) LDED-1200 W sample; (b) LDED-1500 W sample; (c) LDED-1800 W sample; (d) LDED-1200 W+LSP sample; (e) LDED-1500 W+LSP sample; (f) LDED-1800 W+LSP sample
Fig. 11. SEM images of wear surface of LDED samples with magnification and elemental distributions of the square areas. (a)(d) LDED-1200 W sample; (b)(e) LDED-1500 W sample; (c)(f) LDED-1800 W sample
Fig. 12. SEM images of wear surface of LDED+LSP samples with magnification and elemental distributions of the square areas. (a)(d) LDED-1200 W+LSP sample; (b)(e) LDED-1500 W+LSP sample; (c)(f) LDED-1800 W+LSP sample
Fig. 13. Schematic diagrams of friction and wear mechanism under dry sliding conditions. (a) LDED-1200 W sample; (b) LDED-1800 W sample; (c) LDED+LSP typical sample
|
Table 1. Chemical composition of 45 steel matrix
|
Table 2. Chemical composition of H13 tool steel powder
| |||||||||||||||||||
Table 3. Comparison of full width at half maximum (FWHM) of α(110), α(200), and α(211) in LDED samples
| |||||||||||||||||||
Table 4. Comparison of FWHM of α(110), α(200), and α(211) in LDED+LSP samples

Set citation alerts for the article
Please enter your email address
© Copyright 2018-2021 | Chinese Laser Press. All Rights Reserved 沪ICP备15018463号-20