
Yuqiu Xu, Yonglan Yang, Xing Li, Xin Wang, Weiwen Zou, "Chip-scale Brillouin instantaneous frequency measurement by use of one-shot frequency-to-power mapping based on lock-in amplification," Chin. Opt. Lett. 19, 113902 (2021)
- Chinese Optics Letters
- Vol. 19, Issue 11, 113902 (2021)
Abstract
Keywords
1. Introduction
An instantaneous frequency measurement (IFM) is aimed at detecting the frequency of unknown signals immediately in modern radar and electronic reconnaissance applications[
In this Letter, we present a new scheme to implement a chip-scale Brillouin IFM based on the SBS effect in a CMOS-compatible doped silica waveguide chip. Owing to the narrowband filtering effect of SBS, we change the center frequency of the Brillouin filter by frequency sweeping and obtain a one-shot frequency-to-power mapping curve, nominating the amplitude comparison function (ACF). Although the entire Brillouin gain of the doped silica waveguide chip is much smaller than that of long-length optical fibers, a lock-in amplifier is adopted to integrate the Brillouin gain of the waveguide chip in time domain and enhance the measurement accuracy. We successfully measure a Costas frequency modulated signal ranging from 8 GHz to 9 GHz with the measurement error of
2. Principle
SBS is a typical kind of phonon–photon interaction[
Sign up for Chinese Optics Letters TOC. Get the latest issue of Chinese Optics Letters delivered right to you!Sign up now
![]()
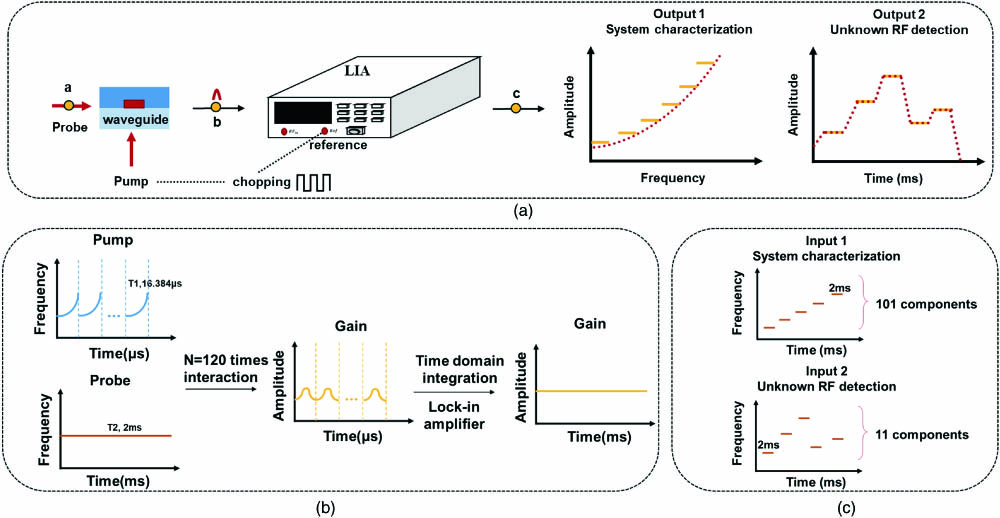
Figure 1.(a) Schematic of the chip-scale Brillouin IFM via a lock-in amplifier (LIA). (b) Illustration of SBS interaction between the pump lightwave and probe lightwave. (c) Probe signal setting for system characterization and unknown RF detection based on the chip-scale Brillouin IFM.
The amplitude of Brillouin gain (
To play a role of the lock-in amplifier, a normal probe–pump configuration and signal settings should be adjusted. As depicted in Fig. 1(a), the pump lightwave is chopped by a square wave, which also functions as the reference signal of the lock-in amplifier. It was proved in Ref. [11] that a nonlinearly frequency sweeping pump signal can exert different response amplitudes since the dwell time of each pump frequency component varies from each other, and the accumulation of Brillouin gain is different. Here, the pump lightwave is also designed as a nonlinearly frequency sweeping pulse with a period of
Figure 1(b) illustrates more details of SBS interaction in the chip-scale Brillouin IFM configuration. The number of interactions (
It indicates that
3. Experimental Setup
Figure 2 shows the experimental setup of the chip-scale Brillouin IFM scheme. A 1552 nm distributed-feedback laser diode (DFB-LD, NEL NLK1C6DAAA) is used as the light source, which is divided into two branches. The probe lightwave (upper branch) is modulated by the microwave signal to be measured or a certain linearly frequency sweeping signal [see Fig. 1(b)] for the ACF characterization via a carrier-suppressed single sideband electro-optic modulator (SSBM1, iXblue MXIQER-LN-30), and the lower sideband of SSBM1 is reserved. The pump lightwave (lower branch) is first modulated by the nonlinearly frequency sweeping signal via SSBM2. The peak-to-peak value of the signal is around 1 V, which determines the SBS modulation depth. The carrier attenuation of SSBM2 is set over 20 dB by adjusting the three DC bias voltages in case the residual carrier modulated by the reference signal generates serious pulse noises and decreases the Brillouin IFM accuracy. Different from the SSBM1, the upper sideband of the SSBM2 is reserved. It is noted that modulation of the two lightwaves to different sidebands enables a broader measurement range. The pump lightwave is chopped by a square wave (1 MHz) via an electro-optic modulator (EOM). Meanwhile, the chopping signal functions as the reference signal of the lock-in amplifier. The output of the erbium-doped fiber amplifier (EDFA1) is set as 14.5 dBm, and the output power of EDFA3 is set as 22 dBm. Two lightwaves with stationary power go through different circulators, respectively, and meet in the doped silica waveguide chip, where SBS interaction is generated. Note that the waveguide (
![]()
Figure 2.Experimental setup of the chip-scale Brillouin IFM via a lock-in amplifier. DFB, distributed-feedback laser; SSBM, single sideband modulator; LIA, lock-in amplifier; AWG, arbitrary waveform generator; OSC, oscilloscope; OSA, optical spectrum analyzer.
4. Result and Discussion
The frequency of the pump lightwave sweeps continuously from 6.25 GHz to 7.25 GHz via an AWG (Keysight M9502A). Meanwhile, we encode the microwave generator (Keysight N5183B) to engender a sequence of 101 frequency components ranging from 8 GHz to 9 GHz. The frequency step is 10 MHz, and dwell time is set to be 2 ms. Note that the sensitivity of the lock-in amplifier is set to be 5 mV, and the AC gain is 34 dB. To attain a sharper system response, the time constant is set as 500 µs, which is shorter than the dwell time of the Costas frequency component. First, an experiment is carried out to acquire the BGS of the waveguide chip for more accurate measurement error analysis. The result shown in the inset of Fig. 3(a) indicates that the BFS of the waveguide chip is 15.24 GHz, and the FWHM of the BGS is about 120 MHz, which is broader than that of the DCF (
![]()
Figure 3.(a) Frequency-to-power mapping curve for system characterization. (b) The Brillouin gain that a Costas frequency modulated signal carries.
Figure 3(a) mainly presents the results of the one-shot frequency-to-power mapping curve. The solid curve shows the experimental data, and it is partially non-monotonous. The bending parts of the ACF curve are mainly caused by the fact that the integration time of the lock-in amplifier is not a strict integer multiple of the actual SBS interaction period. Besides, spontaneous Brillouin scattering (SpBS) concomitantly appears during SBS interaction and introduces fluctuation of the curve. In the non-monotonous area of the ACF, one certain power amplitude can be matched with several frequency components, causing large measurement errors. To compensate for the deficiency, we use the least-squares polynomial fitting method to fit the experimental data, which is shown in the dashed line of Fig. 3(a). It indicates that the ACF after curve fitting is monotonous but it introduces system errors somewhat.
We recode the microwave generator to engender a Costas frequency modulated sequence, consisting of 11 hopping frequency components with a dwell time of 2 ms. Note that normalization of output power is necessary when the hopping time of the Costas frequency modulated signal is larger than or lower than 2 ms. It should be mentioned again that the result is acquired through one-shot measurement without additional time averaging. Figure 3(b) depicts the Brillouin gain of the Costas frequency modulated signal, which is used for inversion of the frequency value. Note that the largest Brillouin gain value is below 15 mV, and most of the Brillouin gain values are below 5 mV. Lower Brillouin gain value means that the measurement results are more easily influenced by system noises. By comparing the received Brillouin gain value with the frequency-to-power mapping curve in Fig. 3(a), the IFM result and error analysis are illustrated in Fig. 4 and Table 1, respectively. Figure 4(a) indicates that the measured results match well with the nominal value, and the measurement error without the least-squares polynomial fitting is within 120 MHz, which is close to the FWHM of the BGS in the waveguide chip. The bending parts of the ACF curve are mainly distributed in the frequency zone of 8–8.5 GHz [see Fig. 3(a)], leading to relatively large measurement errors. The largest error appears at the frequency of 8.5 GHz. As mentioned above, we adopt the polynomial fitting to improve the measurement accuracy, and the kernel is to determine the best fitting coefficient. The larger the coefficient of the polynomial fitting is, the closer it is to the original curve distribution. The integer between 4 and 7 is a good choice for the least-squares polynomial fitting to optimize the original curve distribution. Figure 4(b) illustrates the best result of the polynomial fitting with the coefficient of five, where the measurement error is reduced from 120 MHz to 58 MHz. However, the measurement error of some frequency components, mostly ranging from 8.5 GHz to 9.0 GHz, increases. Note that the flatter the original ACF curve is, the more prominent the improvement on the Brillouin IFM accuracy is.
| Frequency (GHz) | 8.5 | 8.7 | 8.0 | 8.3 | 8.1 | 9.0 | 8.8 | 8.2 | 8.6 | 8.4 | 8.9 |
|---|---|---|---|---|---|---|---|---|---|---|---|
| Error in Fig. | 120 | 26 | 22 | 63 | 37 | 18 | 8 | 68 | 46 | 4 | 12 |
| Error in Fig. | 57 | 42 | 33 | 46 | 24 | 11 | 32 | 30 | 53 | 41 | 9 |
Table 1. Costas Frequency Measurement Errors
![]()
Figure 4.Frequency measurement error analysis (a) without curve fitting and (b) with curve fitting.
5. Conclusion
In conclusion, we have demonstrated a new scheme of chip-scale Brillouin IFM in a doped silica waveguide chip. Meanwhile, the chip-scale scheme can be totally achieved by a CMOS-compatible manufacturing process of the waveguide chip, silicon modulators, and silicon-germanium photodetectors. Although the Brillouin gain is still weak, the lock-in amplifier is adopted to accomplish one-shot frequency-to-power mapping through integration in the time domain without time averaging over signal periods. Theoretically, Brillouin IFM has the ability of cross-band frequency measurement if the bandwidth of modulators is wide enough. In this work, we select part of the X band to demonstrate the ability of the scheme. The Costas frequency modulated signal ranging from 8 GHz to 9 GHz is successfully measured, and the measurement errors are within 58 MHz. Note that the frequency precision of the chip-scale Brillouin IFM scheme is limited by the FWHM (120 MHz) of the SBS in the silica-doped waveguide chip, although it is enhanced slightly by the least-squares polynomial fitting. We might potentially achieve a higher precision of the Brillouin IFM if a waveguide chip with a narrower FWHW is employed.
References
[1] M. Skolnik. Introduction to Radar Systems(2001).
[2] X. Zou, B. Lu, W. Pan, L. Yan, A. Stöhr, J. Yao. Photonics for microwave measurements. Laser Photon. Rev., 10, 711(2016).
[3] D. Marpaung. On-chip photonic-assisted instantaneous microwave frequency measurement system. IEEE Photon. Technol. Lett., 25, 837(2013).
[4] B. Zhu, W. Zhang, S. Pan, J. Yao. High-sensitivity instantaneous microwave frequency measurement based on a silicon photonic integrated Fano resonator. J. Lightwave Technol., 37, 2527(2019).
[5] D. Marpaung, J. Yao, J. Capmany. Integrated microwave photonics. Nat. Photon., 13, 80(2019).
[6] Y. Zhou, F. Zhang, S. Pan. Instantaneous frequency analysis of broadband LFM signals by photonics-assisted equivalent frequency sampling. Chin. Opt. Lett., 19, 013901(2021).
[7] Y. Chen, W. Zhang, J. Liu, J. Yao. On-chip two-step microwave frequency measurement with high accuracy and ultra-wide bandwidth using add-drop micro-disk resonators. Opt. Lett., 44, 2402(2019).
[8] M. Pagani, B. Morrison, Y. Zhang, A. Casas-Bedoya, T. Aalto, M. Harjanne, M. Kapulainen, B. J. Eggleton, D. Marpaung. Low-error and broadband microwave frequency measurement in a silicon chip. Optica, 2, 751(2015).
[9] M. Burla, X. Wang, M. Li, L. Chrostowski, J. Azaña. Wideband dynamic microwave frequency identification system using a low-power ultracompact silicon photonic chip. Nat. Commun., 7, 13004(2016).
[10] H. Jiang, D. Marpaung, M. Pagani, K. Vu, D. Choi, S. J. Madden, L. Yan, B. J. Eggleton. Wide-range, high-precision multiple microwave frequency measurement using a chip-based photonic Brillouin filter. Optica, 3, 30(2016).
[11] W. Zou, X. Long, X. Li, G. Xin, J. Chen. Brillouin instantaneous frequency measurement with an arbitrary response for potential real-time implementation. Opt. Lett., 44, 2045(2019).
[12] B. J. Eggleton, C. G. Poulton, P. T. Rakich, M. J. Steel, G. Bahl. Brillouin integrated photonics. Nat. Photon., 13, 664(2019).
[13] S. Li, X. Li, W. Zhang, J. Chen, W. Zou. Investigation of Brillouin properties in high-loss doped silica waveguides by comparison experiment. IEEE Photon. Technol. Lett., 32, 948(2020).
[14] E. P. Ippen, R. H. Stolen. Stimulated Brillouin scattering in optical fibers. Appl. Phys. Lett., 21, 539(1972).
[15] K. Hu, L. Yi, W. Wei, W. Hu. Microwave photonic filter design and optimization based on stimulated Brillouin scattering using a directly modulated pump. Chin. Opt. Lett., 17, 060603(2019).
[16] J. H. Scofield. Frequency-domain description of a lock-in amplifier. Am. J. Phys., 62, 129(1994).


Set citation alerts for the article
Please enter your email address

© Copyright 2018-2021 | Chinese Laser Press. All Rights Reserved 沪ICP备15018463号-20