• High Power Laser Science and Engineering
  • Vol. 7, Issue 2, 02000e24 (2019)
C. D. Armstrong1、2、†,*, C. M. Brenner2, C. Jones3, D. R. Rusby2, Z. E. Davidson1, Y. Zhang2、4, J. Wragg2, S. Richards2, C. Spindloe2, P. Oliveira2, M. Notley2, R. Clarke2, S. R. Mirfayzi5, S. Kar5, Y. Li4, T. Scott3, P. McKenna1, and D. Neely2
Author Affiliations
  • 1Department of Physics SUPA, University of Strathclyde, Glasgow G4 0NG, UK
  • 2Central Laser Facility, STFC Rutherford Appleton Laboratory, Harwell, Oxford OX11 0QX, UK
  • 3Interface Analysis Centre, HH Wills Physics Laboratory, Tyndall Avenue, Bristol BS8 1TL, UK
  • 4Beijing National Laboratory for Condensed Matter Physics, Institute of Physics, Chinese Academy of Sciences, Beijing 100190, China
  • 5Centre for Plasma Physics, Queen’s University Belfast, Belfast BT7 1NN, UK
  • show less
    DOI: 10.1017/hpl.2019.8 Cite this Article Set citation alerts
    C. D. Armstrong, C. M. Brenner, C. Jones, D. R. Rusby, Z. E. Davidson, Y. Zhang, J. Wragg, S. Richards, C. Spindloe, P. Oliveira, M. Notley, R. Clarke, S. R. Mirfayzi, S. Kar, Y. Li, T. Scott, P. McKenna, D. Neely. Bremsstrahlung emission from high power laser interactions with constrained targets for industrial radiography[J]. High Power Laser Science and Engineering, 2019, 7(2): 02000e24 Copy Citation Text show less
    Target geometries for the experimental campaign: (a), (b) foil targets, (a) top view with laser incidence highlighted and (b) front view; (c) side view of wire target.
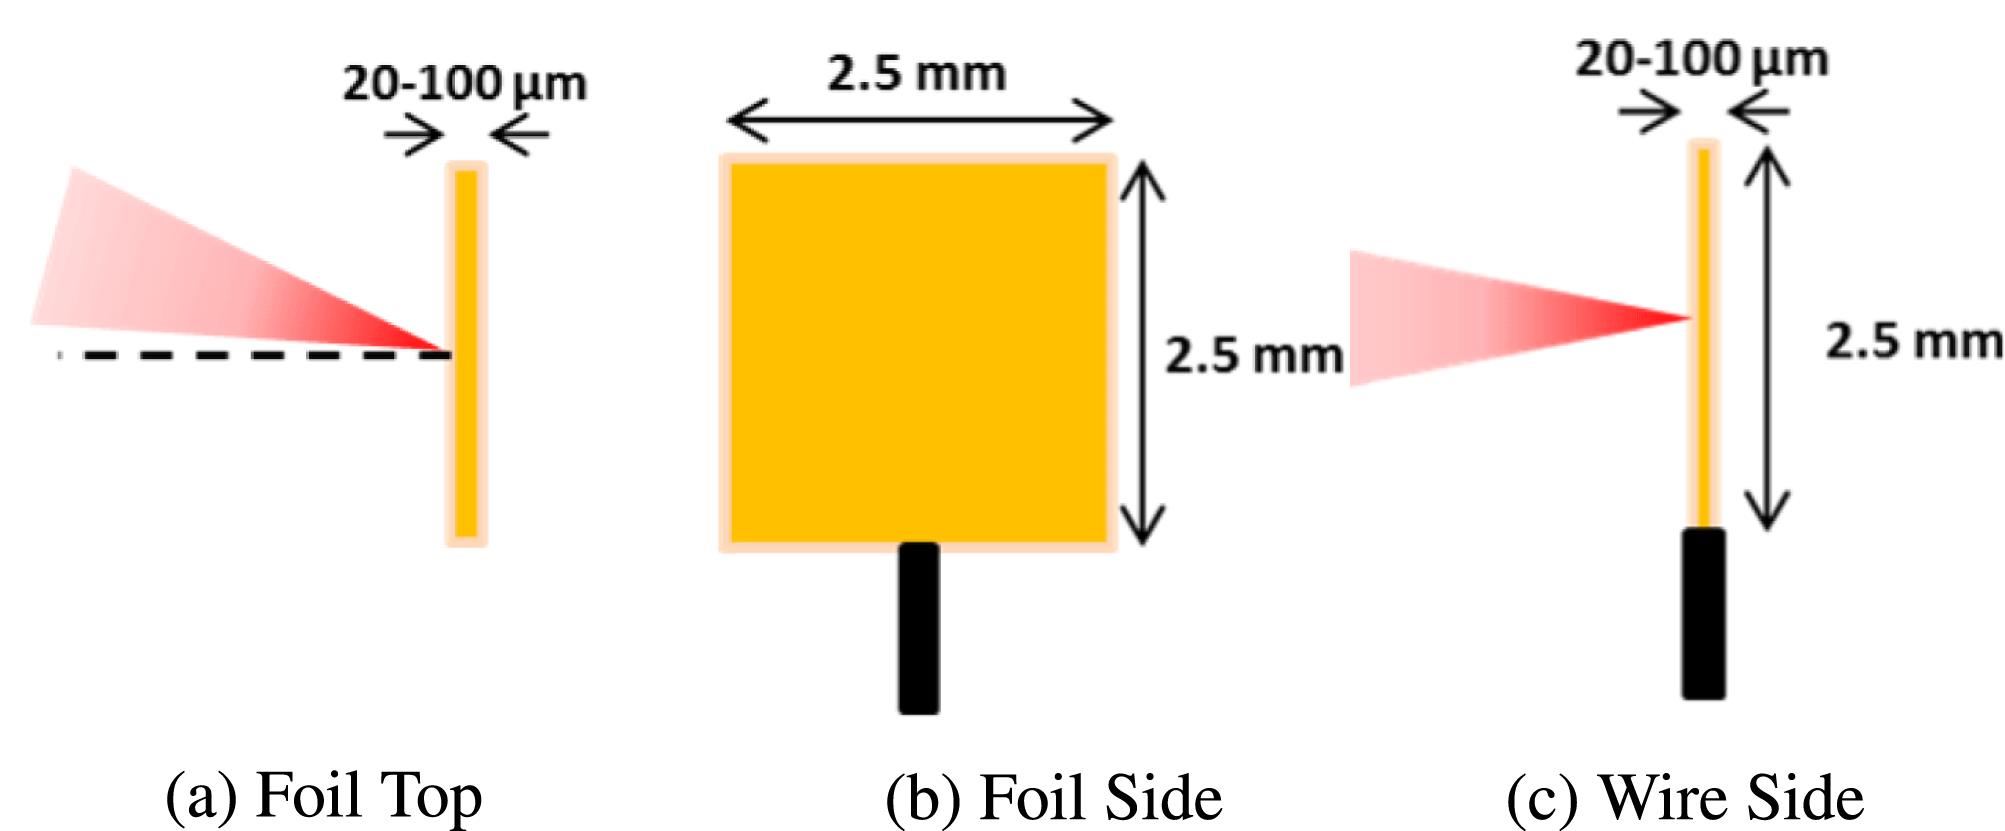
    Fig. 1. Target geometries for the experimental campaign: (a), (b) foil targets, (a) top view with laser incidence highlighted and (b) front view; (c) side view of wire target.
    Schematic of the primary imaging diagnostics. Main image shows the emission line, with penumbral foils and hard X-ray spectrometers included. The inset is an expansion of the penumbral foil setup, and the grey cone represents the forward X-ray emission from target, with all distances in mm measured from target position.
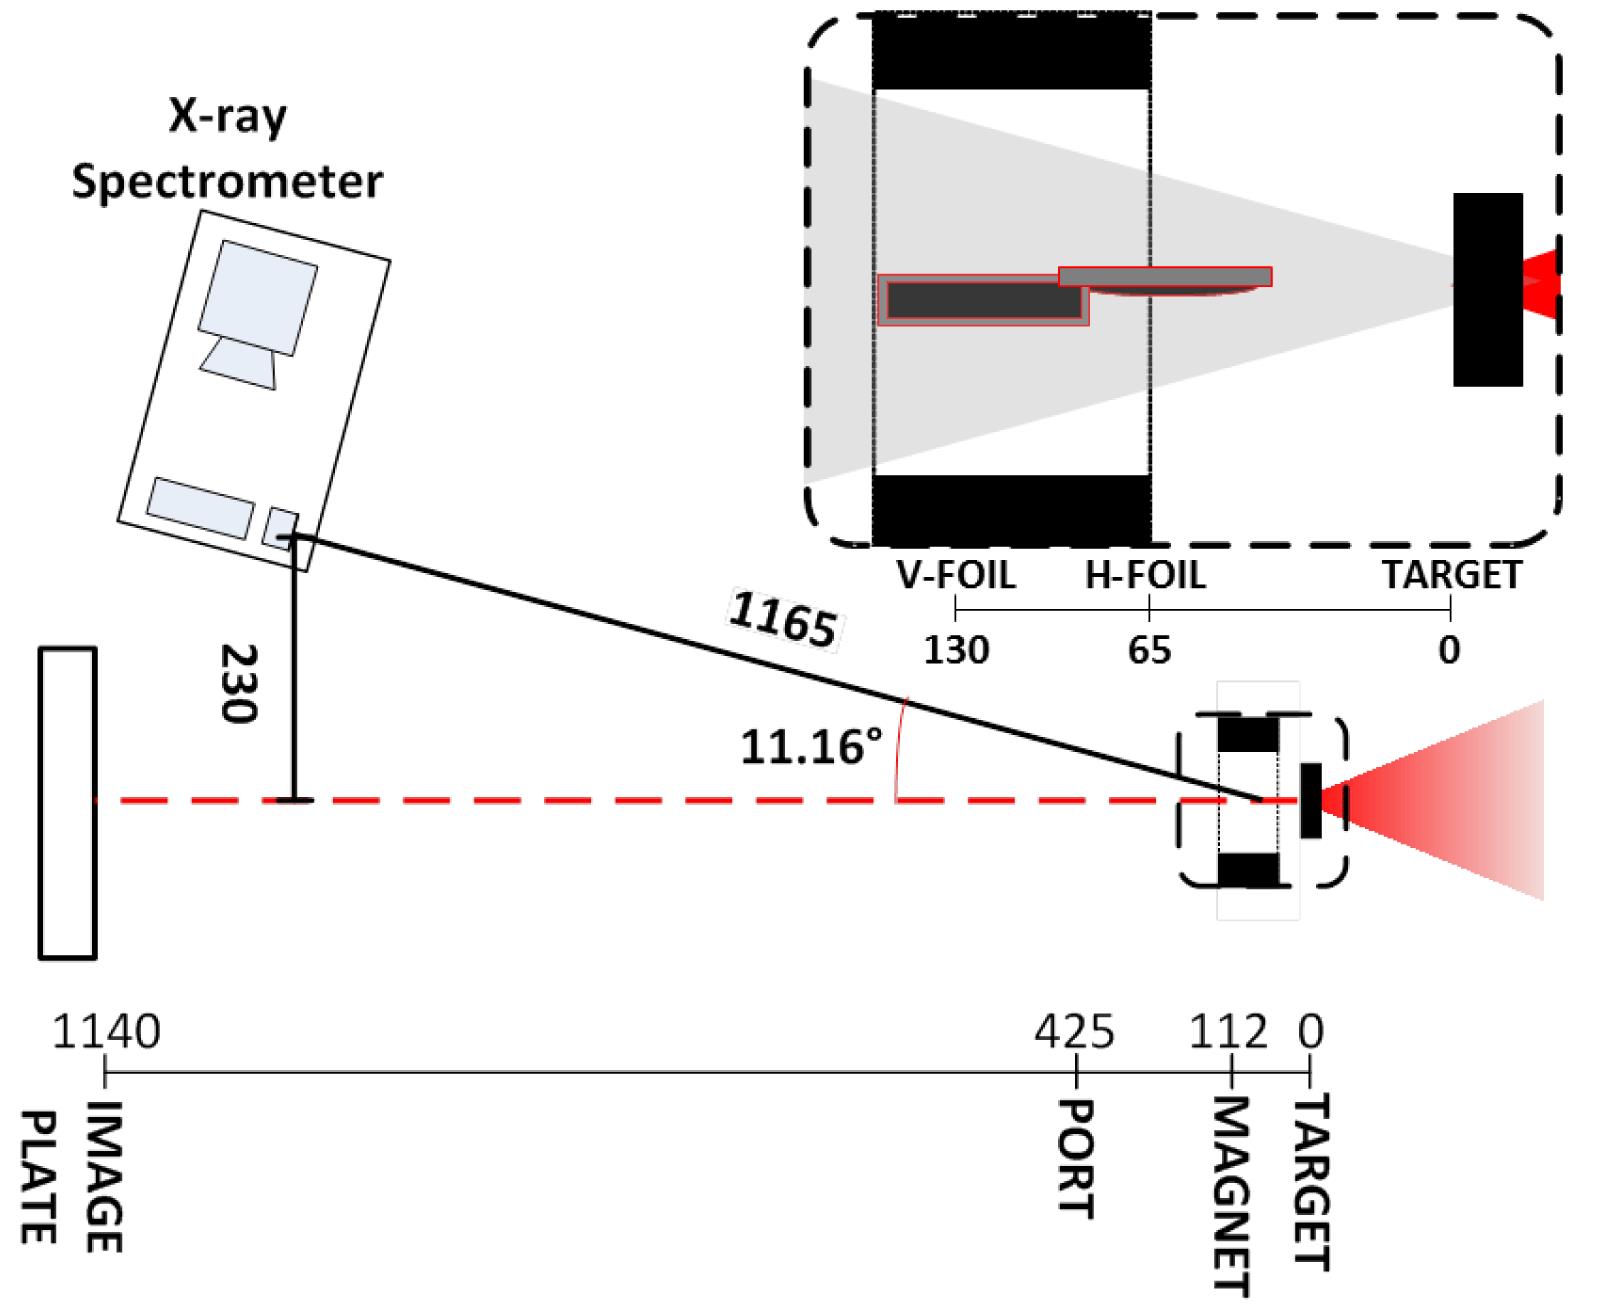
    Fig. 2. Schematic of the primary imaging diagnostics. Main image shows the emission line, with penumbral foils and hard X-ray spectrometers included. The inset is an expansion of the penumbral foil setup, and the grey cone represents the forward X-ray emission from target, with all distances in mm measured from target position.
    Two-source structure for penumbral lineouts.
    Fig. 3. Two-source structure for penumbral lineouts.
    Penumbral radiograph, scale in mPSL (unit of flux for IP), and lineout for (a) foil and (b) wire targets. The dashed line in each radiograph is where the lineout is determined.
    Fig. 4. Penumbral radiograph, scale in mPSL (unit of flux for IP), and lineout for (a) foil and (b) wire targets. The dashed line in each radiograph is where the lineout is determined.
    Spectral measurements taken from hard X-ray spectrometers $11^{\circ }$ from target normal, single-shot measurements made in parallel to source size measurements. (a) Vertical and horizontal source from target types and materials measured by the penumbral foils, (b) flux on the first crystal per incident laser Joule, and (c) effective temperature of the X-ray emission inferred via the technique discussed by Rusby et al.[31].
    Fig. 5. Spectral measurements taken from hard X-ray spectrometers $11^{\circ }$ from target normal, single-shot measurements made in parallel to source size measurements. (a) Vertical and horizontal source from target types and materials measured by the penumbral foils, (b) flux on the first crystal per incident laser Joule, and (c) effective temperature of the X-ray emission inferred via the technique discussed by Rusby et al.[31].
    Results from PIC simulations. (a) Electron density (red scale) and $\boldsymbol{E}$-field (blue scale) spatial maps for the foil simulation at 500 fs. (b) Same as (a) but for wire simulation. (c) Cumulative on-axis electron density over the entire simulation. $0~\unicode[STIX]{x03BC}\text{m}$ indicates front surface for each target. (d) Refluxing electron spectra with a two-temperature distribution, see Table 1 for values.
    Fig. 6. Results from PIC simulations. (a) Electron density (red scale) and $\boldsymbol{E}$-field (blue scale) spatial maps for the foil simulation at 500 fs. (b) Same as (a) but for wire simulation. (c) Cumulative on-axis electron density over the entire simulation. $0~\unicode[STIX]{x03BC}\text{m}$ indicates front surface for each target. (d) Refluxing electron spectra with a two-temperature distribution, see Table 1 for values.
    Spectral output from the GEANT4 simulations. (a) Emitted X-ray spectra using the simulated temperatures from EPOCH, temperature fits shown with a dashed line. $\text{K}\unicode[STIX]{x03B1}$ line in gold shown with a black dot line. (b) Effective X-ray temperature as a function of target thickness showing a similar trend to Figure 5(c).
    Fig. 7. Spectral output from the GEANT4 simulations. (a) Emitted X-ray spectra using the simulated temperatures from EPOCH, temperature fits shown with a dashed line. $\text{K}\unicode[STIX]{x03B1}$ line in gold shown with a black dot line. (b) Effective X-ray temperature as a function of target thickness showing a similar trend to Figure 5(c).
    Spatial output from the GEANT4 simulations. (a) Source location of detected X-rays within a $25~\unicode[STIX]{x03BC}\text{m}$ wire target. (b) Same as (a) but for a foil target. (c) Horizontal line out of each source with the FWHM displayed. (d) Source size as a function of target thickness showing a similar trend to Figure 5(a).
    Fig. 8. Spatial output from the GEANT4 simulations. (a) Source location of detected X-rays within a $25~\unicode[STIX]{x03BC}\text{m}$ wire target. (b) Same as (a) but for a foil target. (c) Horizontal line out of each source with the FWHM displayed. (d) Source size as a function of target thickness showing a similar trend to Figure 5(a).
    Demonstration of the reduced source size from narrow wire targets. (a) A processed XRT radiograph from a continuous 2 s exposure, (b) a single-shot acquisition from a $100~\unicode[STIX]{x03BC}\text{m}$ Ta foil target and (c) a single-shot acquisition from $100~\unicode[STIX]{x03BC}\text{m}$ Au wire target. (d) The edge-spread function (ESF) taken at the edge of the penny for both the foil and wire targets, the dashed lines are polynomial fits of the data.
    Fig. 9. Demonstration of the reduced source size from narrow wire targets. (a) A processed XRT radiograph from a continuous 2 s exposure, (b) a single-shot acquisition from a $100~\unicode[STIX]{x03BC}\text{m}$ Ta foil target and (c) a single-shot acquisition from $100~\unicode[STIX]{x03BC}\text{m}$ Au wire target. (d) The edge-spread function (ESF) taken at the edge of the penny for both the foil and wire targets, the dashed lines are polynomial fits of the data.
    ParameterWireFoil
    $T_{\text{hot}/\text{MeV}}$1.92.1
    $T_{\text{cold}/\text{MeV}}$1.31.2
    $N_{\text{electron}/10^{18}}$5.73.7
    $N_{\unicode[STIX]{x1D6FE}}$2.41
    $\unicode[STIX]{x1D702}_{e\rightarrow \unicode[STIX]{x1D6FE}/\%}$9.662.7
    Table 1. EPOCH and GEANT4 simulation results, $N_{\unicode[STIX]{x1D6FE}}$ for the wire simulations is normalized to the foil results.
    C. D. Armstrong, C. M. Brenner, C. Jones, D. R. Rusby, Z. E. Davidson, Y. Zhang, J. Wragg, S. Richards, C. Spindloe, P. Oliveira, M. Notley, R. Clarke, S. R. Mirfayzi, S. Kar, Y. Li, T. Scott, P. McKenna, D. Neely. Bremsstrahlung emission from high power laser interactions with constrained targets for industrial radiography[J]. High Power Laser Science and Engineering, 2019, 7(2): 02000e24
    Download Citation