
Yuyang Feng, Kai Zeng, Xiaocong He, Xinyu Sun, Tao Wei. Laser Spot Weld Bonding and Joint Strength Analysis of Dual-Phase Steels[J]. Laser & Optoelectronics Progress, 2018, 55(3): 031404
- Laser & Optoelectronics Progress
- Vol. 55, Issue 3, 031404 (2018)
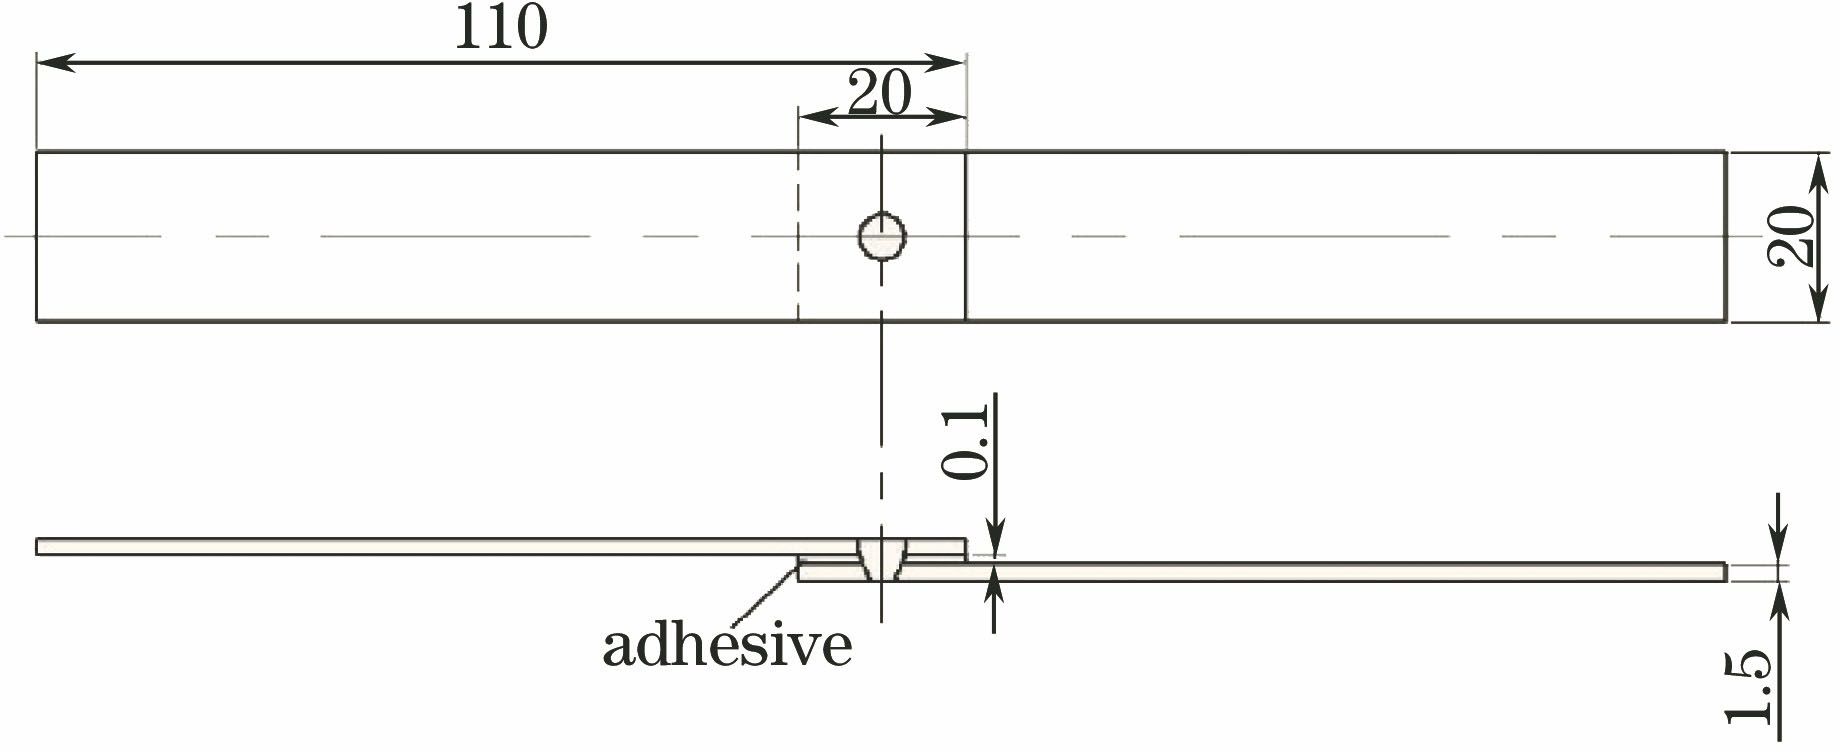
Fig. 1. Sketch map of lap specimen
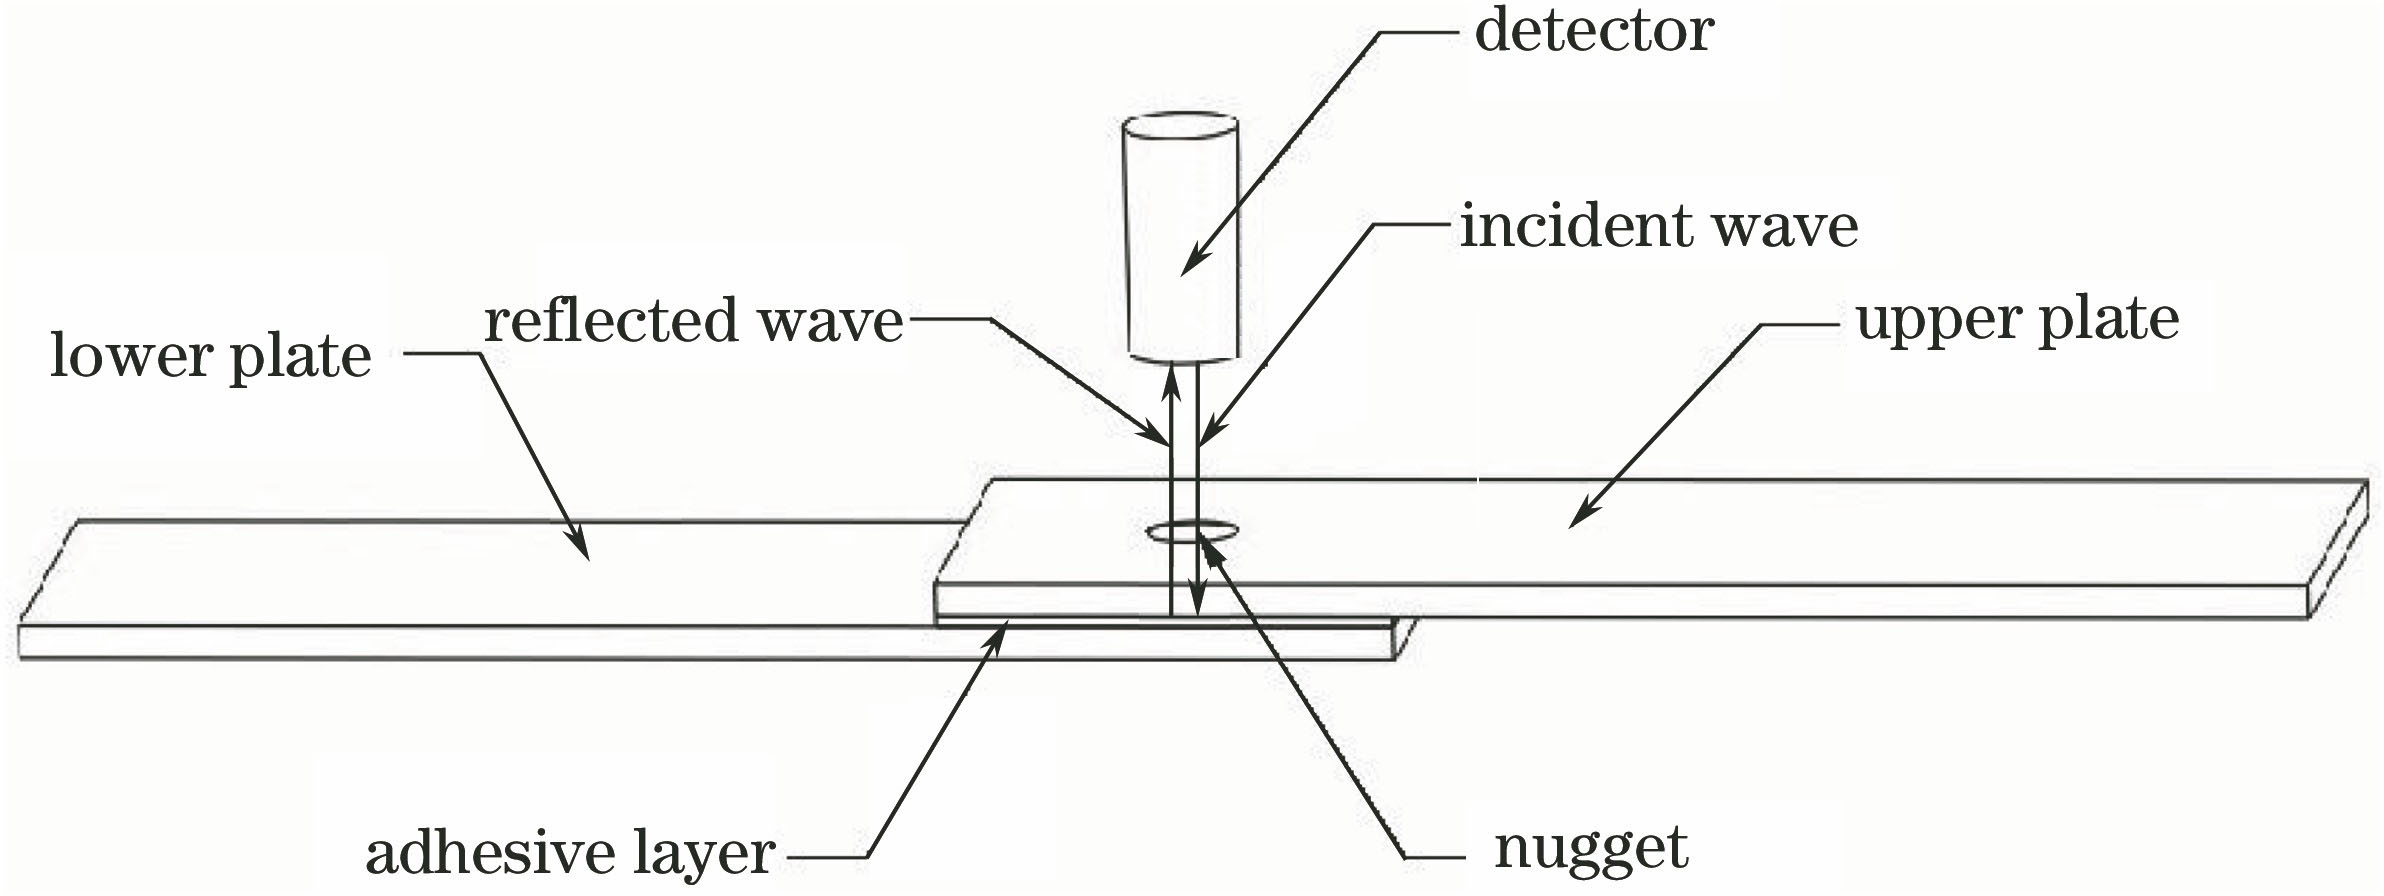
Fig. 2. Schematic of ultrasonic C-scan imaging detection
Fig. 3. Surface morphologies of solder joints in 1-9 groups. (a) Group 1; (b) group 2; (c) group 3; (d) group 4; (e) group 5; (f) group 6; (g) group 7; (h) group 8; (i) group 9
Fig. 4. Ultrasonic C-scanning images. (a) Group 1; (b) group 7; (c) group 9
Fig. 5. Ultrasonic A-scan signals of joints in different regions. (a) Nugget zone; (b) heat-affected zone; (c) adhesive zone;(d)cavity zone
Fig. 6. Interactive effect of laser power and welding time with peak loads
Fig. 7. Macro-morphologies of fatigue fractures. (a) Group 1; (b) group 7; (c) group 9
Fig. 8. Micro-morphologies of fatigue fractures. (a) Point A; (b) point B; (c) point C; (d) point D
|
Table 1. Chemical compositions of DP590 (mass fraction, %)
|
Table 2. Tensile properties of DP590
|
Table 3. Scheme of orthogonal experiment
|
Table 4. Peak load of joints
|
Table 5. Range analysis for peak loads under three process parametersN

Set citation alerts for the article
Please enter your email address
© Copyright 2018-2021 | Chinese Laser Press. All Rights Reserved 沪ICP备15018463号-20