
Zexiao Xie, Junpeng Li, Shukai Chi. Underwater Binocular Measurement Method Based on Line-Structured Light[J]. Chinese Journal of Lasers, 2020, 47(5): 0504004
- Chinese Journal of Lasers
- Vol. 47, Issue 5, 0504004 (2020)
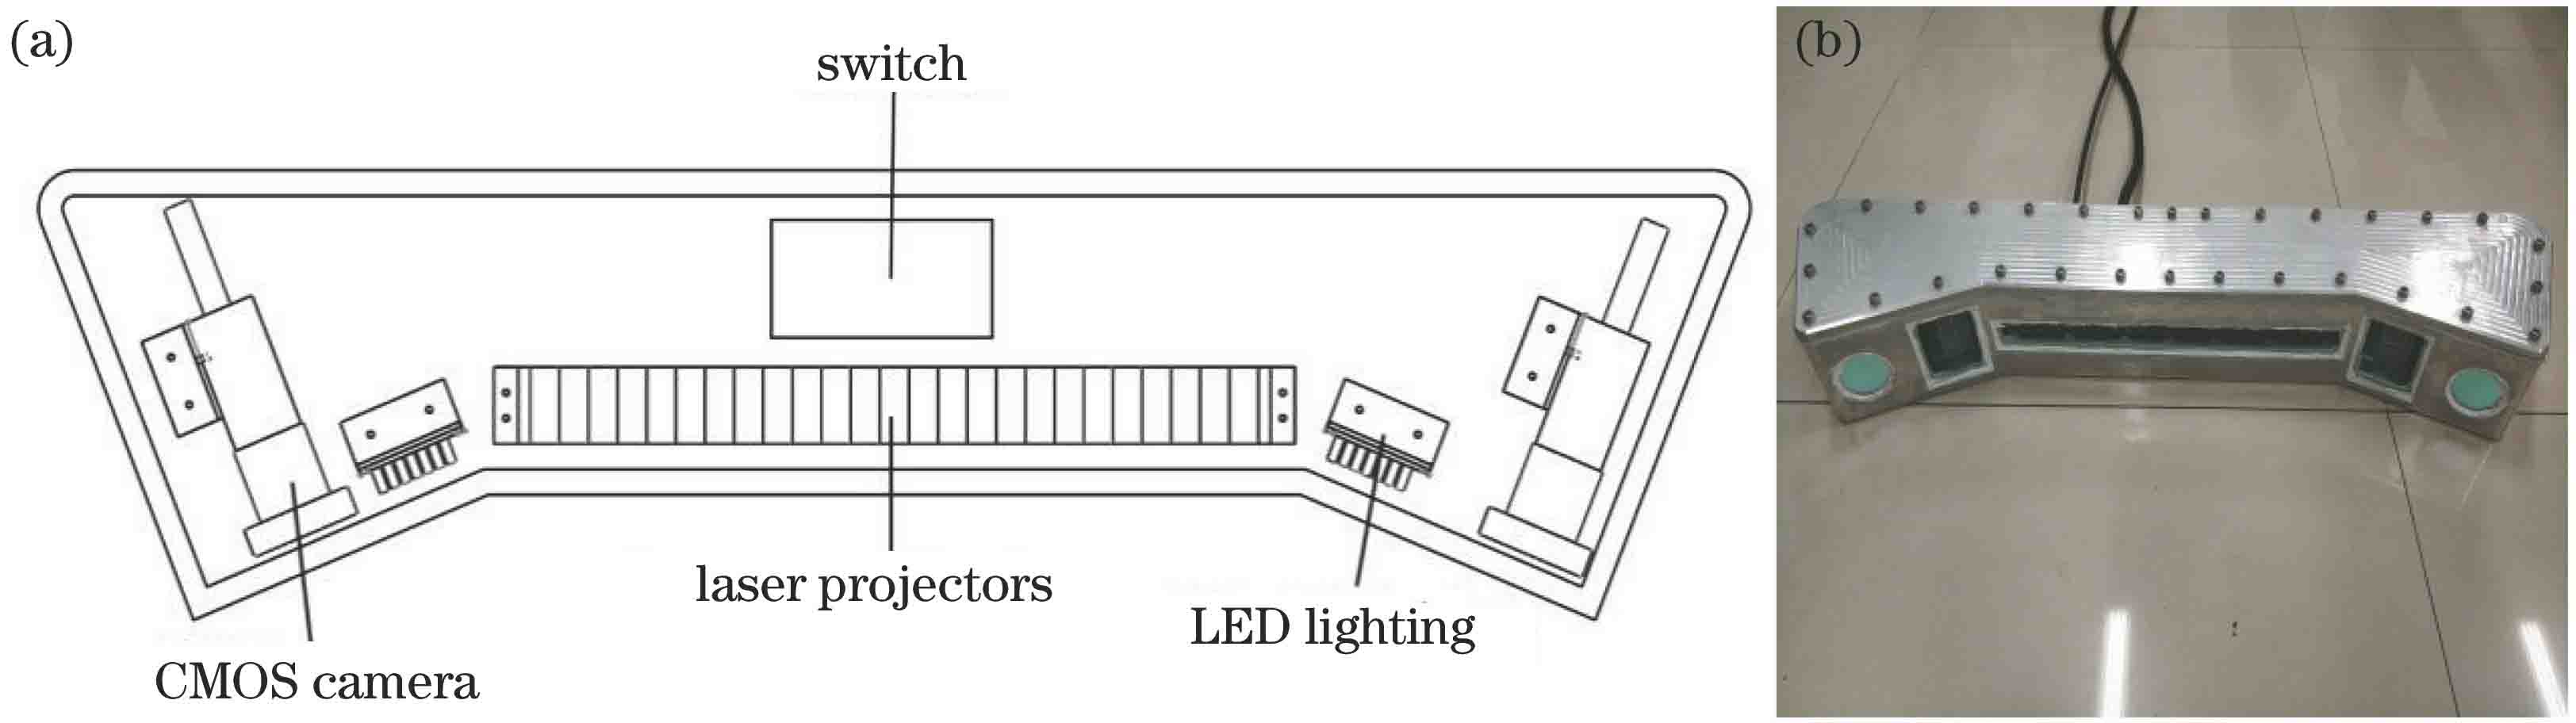
Fig. 1. Underwater binocular measurement system. (a) Top view of internal structure; (b) seal outline drawing of equipment
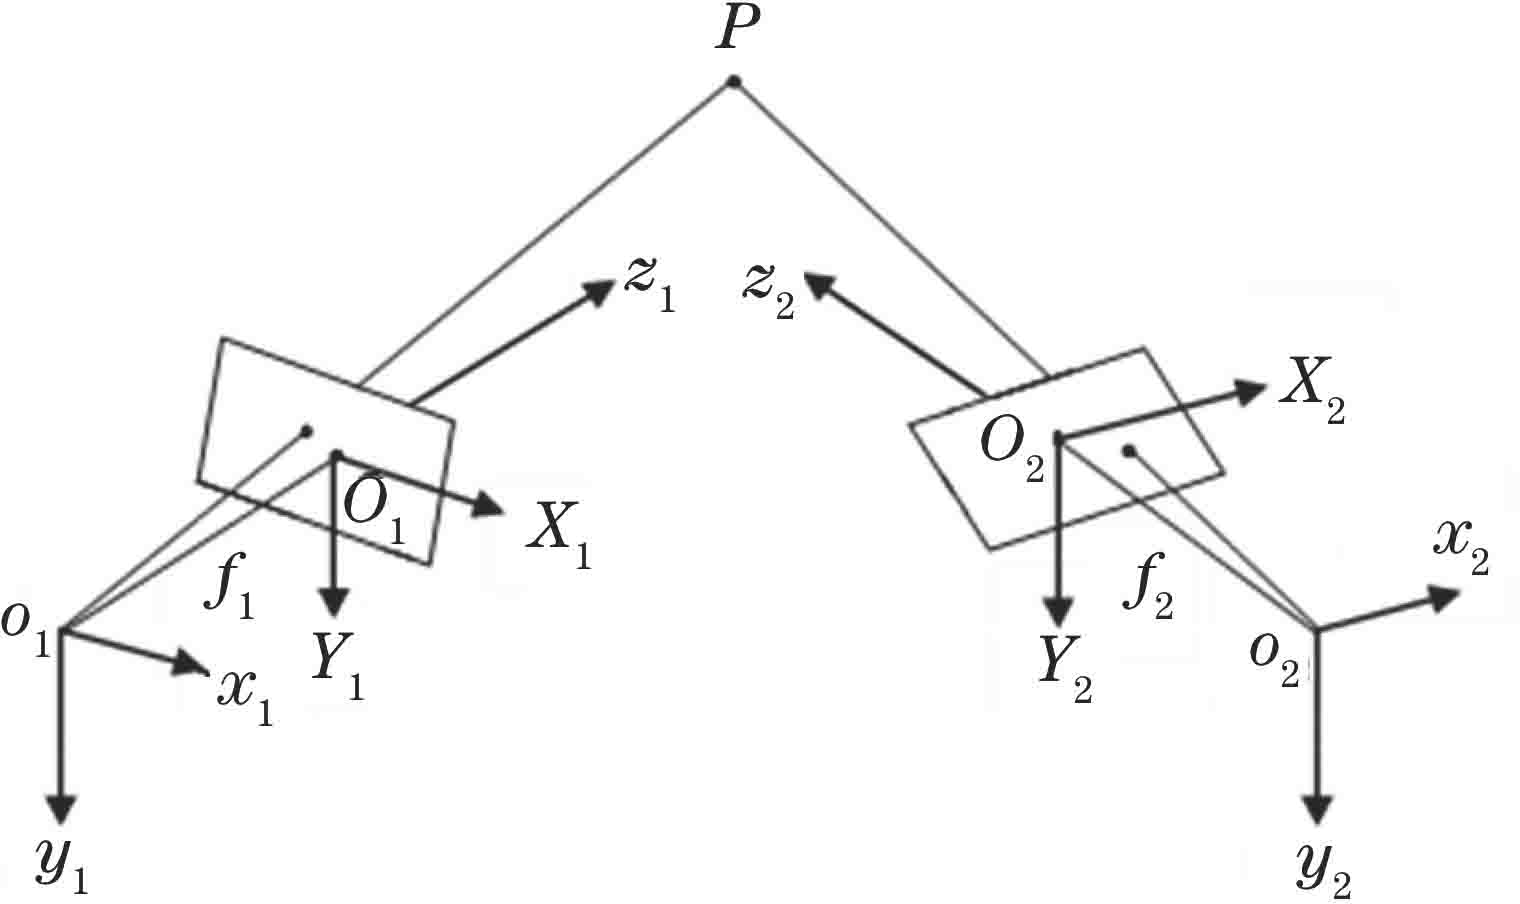
Fig. 2. Binocular stereo vision model
Fig. 3. Flow chart of measurement system
Fig. 4. Line-structured light array
Fig. 5. Measurement model of underwater binocular system
Fig. 6. Underwater binocular system imaging
Fig. 7. Schematic of polar geometric constraints
Fig. 8. Intersection of external polar and light bar
Fig. 9. Comparison results of feature extraction. (a) Cylinder; (b) sheet metal parts; (c) cylindrical point cloud of proposed method; (d) cylindrical point cloud of image method; (e) point cloud of sheet metal parts of proposed method; (f) point cloud of sheet metal parts of image method
Fig. 10. Test results of laser stripe extraction. (a) Custom pattern; (b) extraction result of custom pattern; (c) left camera image of irregular metal plate; (d) extraction result of irregular metal plate; (e) left camera image of stone; (f) extraction result of stone
Fig. 11. Spherical point clouds obtained from one measurement
Fig. 12. Three-dimensional measurement of underwater sheet metal parts. (a) Experimental environment; (b) measured object; (c) three-dimensional point clouds
Fig. 13. Three-dimensional measurement of underwater rock. (a) Measured object; (b) three-dimensional point clouds
|
Table 1. Measurement results and errors of reference sphere(unit:mm)
|
Table 2. Measurement results and errors of different methods(unit:mm)mm

Set citation alerts for the article
Please enter your email address
© Copyright 2018-2021 | Chinese Laser Press. All Rights Reserved 沪ICP备15018463号-20