Yan Zhao, Haiwei Zhang. Displacement measurement method based on laser self-mixing interference in the presence of speckle[J]. Chinese Optics Letters, 2020, 18(5): 051201
Copy Citation Text
In order to achieve the accurate measurement of displacement, this Letter presents a self-mixing interference displacement measurement method suitable for the speckle effect. Because of the speckle effect, the amplitude of the self-mixing interference signal fluctuates greatly, which will affect the measurement accuracy of displacement. The ensemble empirical mode decomposition is used to process the interference signal, which can filter out high-frequency noise and low-frequency noise at the same time. The envelope of the self-mixing interference signal is extracted by Hilbert transform, and it is used to realize the normalization of the signal. Through a series of signal processing, the influence of speckle can be effectively reduced, and the self-mixing interference signal can be transformed into standard form. The displacement can be reconstructed by fringe counting and the interpolation method. The experimental results show that the method is successfully applied to the displacement measurement in the presence of speckle, which verifies the effectiveness and feasibility of the method.
Laser self-mixing interference (SMI) refers to the interference between the emitted laser beam and the scattered laser beam coupled back into the laser cavity[1,2]. The SMI phenomenon can be explained as the external optical feedback effect. The SMI measurement technology has been applied to many fields such as distance[3], velocity[4], angle[5], acceleration[6], and displacement[7].
When the long-range displacement measurement or rough surface measurement is carried out, the speckle effect will appear, which will affect the measurement accuracy[8]. The speckle effect refers to the interference formed between light waves scattered back by scattering units of random surface. For the SMI system, the main factors that affect the speckle include roughness of the target surface, beam spot size, and the distance between the laser and target. The speckle can cause amplitude fading and change of the optical feedback level. The amplitudes of derivatives of speckle affected interference fringes fluctuate greatly, so it is difficult to determine a suitable threshold to detect the interference fringes. Therefore, for the speckle affected SMI signal, it is difficult to reconstruct the displacement accurately by the fringe counting method based on the derivative of the SMI signal[9].
In order to avoid amplitude fading in the speckle affected SMI signal, an adaptive optical element is used to change the focal length of the system[10]. The optical device needs to be optimized according to power, position, diameter of lens, and other parameters, thus increasing the complexity of the system design. The SMI signal processing method based on envelope tracking is presented to measure long-range displacement in the presence of speckle[9]. This method has the advantages of simple principle, convenient operation, and no need for additional electronic or mechanical devices. In order to reduce the influence of amplitude variations induced by speckle effect, the instantaneous phase of the SMI signal is calculated by Hilbert transform[11]. The displacement of the external target is reconstructed by the derivative of instantaneous phase.
Sign up for Chinese Optics Letters TOC. Get the latest issue of Chinese Optics Letters delivered right to you!Sign up now
The speckle affected SMI signal is a nonlinear, non-stationary signal, and the processing methods for the nonlinear, non-stationary signal include short-time Fourier transformation[12], wavelet transformation[13], empirical mode decomposition (EMD)[14], ensemble EMD (EEMD)[15], and variational mode decomposition (VMD)[16]. The speckle affected SMI signal may contain both high-frequency noise and low-frequency noise. Because the VMD method is based on the narrow-band assumption, it does not explicitly deal with a global trend in the signal[17]. In the process of EMD, mode mixing will occur if there is an abnormal incident (such as impulse interference) in the original signal. Mode mixing refers to an intrinsic mode function (IMF) containing significantly different time scale characteristics or similar time scale characteristics in different IMFs. In order to inhibit mode mixing, EEMD is proposed to adaptively decompose the signal into several IMFs by using white noise to smooth the abnormal incident in the signal and eliminate the influence of white noise with the multiple mean method. In terms of comprehensive performance, EEMD is suitable for processing the speckle affected SMI signal.
Similar to the traditional laser interference, each interference fringe of the SMI signal corresponds to the displacement change of a half-wavelength of the external target. Therefore, the displacement of a target can be measured by calculating the number of interference fringes[18]. Combining the interpolation method with the fringe counting method, the displacement can be measured conveniently and accurately. In order to accurately detect the position of the SMI signal jump point corresponding to phase discontinuity, the optical feedback level factor should be in the range of , which corresponds to the moderate feedback regime.
In this Letter, the displacement measurement method based on SMI in the presence of speckle is presented. The filtering method based on EEMD is introduced. The envelope signal calculated by Hilbert transform is used to normalize the filtered SMI signal. The displacement is reconstructed by the fringe counting method and the interpolation method. Finally, the effectiveness of the proposed method is verified by experiments.
The theory model of SMI is described as follows[1,2]: where is the optical feedback level factor; is the laser linewidth enhancement factor, which represents the ratio of the real part change to the imaginary part change of the complex refractive index of the laser medium[19]; and are the laser phases with and without optical feedback; is the external roundtrip delay; and are the laser powers with and without optical feedback; is the modulation index.
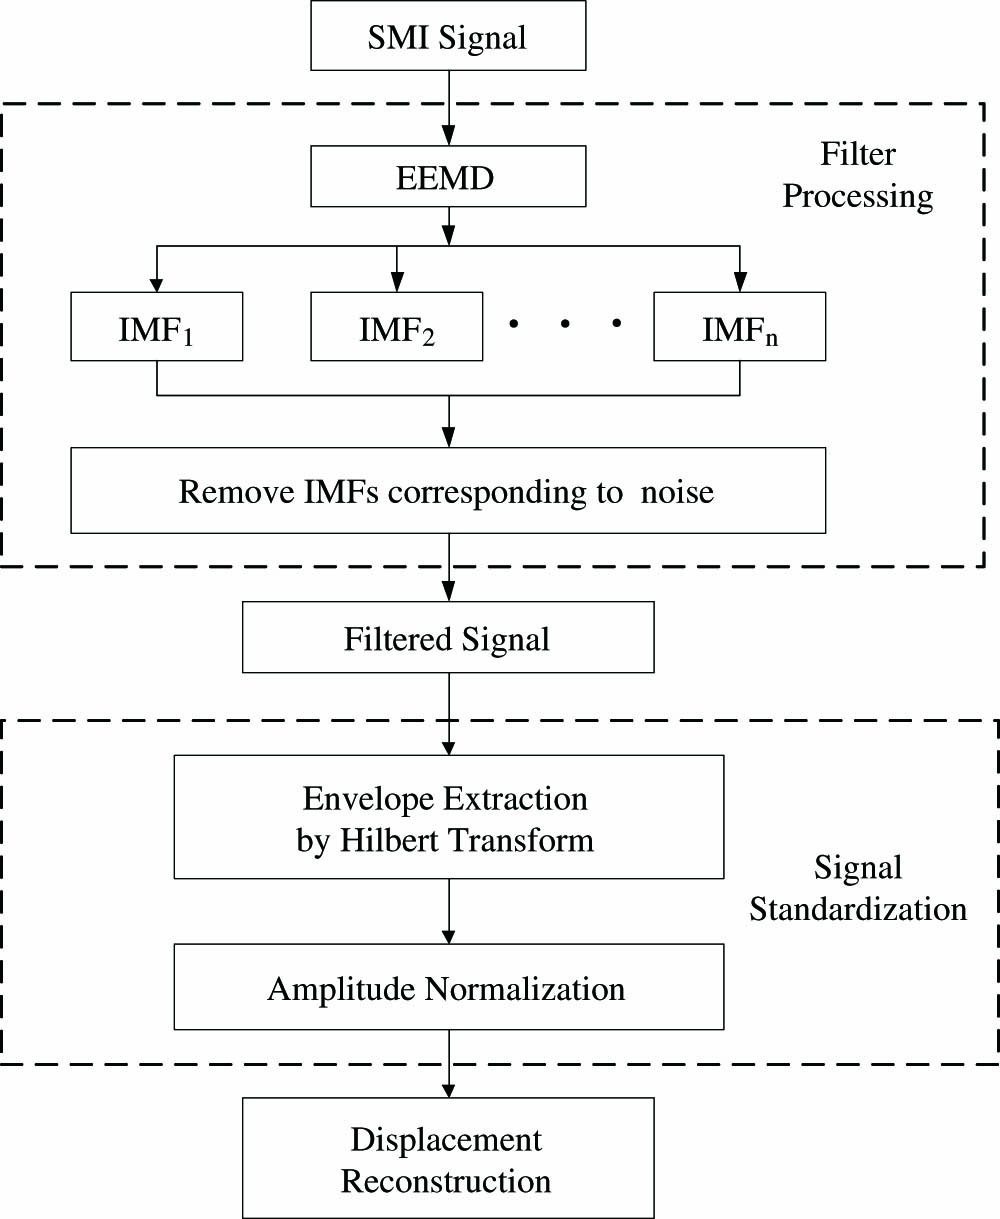
The principle of displacement measurement based on SMI is shown in Fig. 1. The SMI signal is decomposed into several IMFs by EEMD. The IMFs corresponding to noise are eliminated, and the remaining IMFs constitute the filtered SMI signal. Through envelope calculation and amplitude normalization, the SMI signal is transformed into a standard form for convenient processing. Finally, the fringe counting method and interpolation method are used for displacement reconstruction.
Figure 1.Schematic diagram of displacement measurement.
The specific steps of EEMD method are as follows[15].A new signal is generated by adding white noise to the original signal , corresponding to the optical power output of the laser, Perform EMD to decompose in terms of IMFs[14].Repeat steps (1) and (2) for times; it is required to add different Gauss white noise with the same standard deviation. The IMF is denoted as , which indicates the th component obtained at the th decomposition.The final result is obtained by averaging the signal : where is the number of artificial observations of the signal obtained by adding white noise, and is the th IMF of the original signal.
EEMD involves a large number of iterative algorithms, resulting in a large amount of computation. Therefore, EEMD requires a high configuration of the running environment.
The Hilbert transformation of the real value signal is defined as
The analytic signal corresponding to is where envelope signal can be expressed as
The normalized signal corresponding to is
The principle of displacement reconstruction is shown in Fig. 2, and the specific steps are as follows. The SMI signal with normalization is shown in Fig. 2(a).As shown in Fig. 2(b), the positions of jump points corresponding to phase discontinuities are determined by the derivative of the SMI signal. The position of the turning point is set as the middle of the two adjacent positive and negative derivatives. The symbol of the turning point is the same as that of the previous jump point.The laser wavelength without optical feedback is expressed as . The value of displacement signal adds or subtracts by the position and sign of the jump point. The value of the displacement signal adds or subtracts by the position and sign of the turning point[20]. The discrete displacement signal is shown in Fig. 2(c).The discrete signal is smoothed by cubic spline interpolation to reconstruct the displacement signal, as shown in Fig. 2(d).
Figure 2.Schematic diagram of displacement reconstruction: (a) SMI signal; (b) derivative of SMI signal; (c) result of fringe counting method; (d) result of interpolation method.
The experimental system based on SMI is shown in Fig. 3. The laser diode (LD) with a wavelength of 785 nm is driven by a constant current of 130 mA. The temperature of the LD is maintained at . The external cavity length is modulated by a piezoelectric transducer (PZT) with a periodic sinusoidal drive signal. The vibration frequency of the PZT is set at 50 Hz, and the peak-peak amplitude is set at 8 μm. The photodetector is packaged at the back of the LD, which can detect the optical power of the LD and transmit it to the detection circuit. The sampling frequency is 1 MHz. The speckle can be generated by adjusting the size of the spot or the distance between the external object and laser.
Figure 3.SMI experimental system of displacement measurement.
The experimental SMI signal affected by speckle is shown in Fig. 4. Because of the speckle effect, the envelope of the SMI signal changes constantly. It can be seen from the local enlargement of the SMI signal that the amplitudes of different SMI interference fringes vary greatly, which will affect the subsequent displacement reconstruction. For the experimental signal, the optical feedback level factor ranges from 1.2 to 1.8.
Figure 4.(a) Experimental SMI signal of PZT vibration; (b) local amplification of experimental SMI signal of PZT vibration.
The EEMD result of the experimental SMI signal is shown in Fig. 5. The ratio of the standard deviation of the added noise to that of the SMI signal is 0.2, and is 100. The filtered signals composed of different IMFs are shown in Fig. 6. Compared with other filtered signals, the amplitude of the filtered signal composed of to is closer to that of the original signal, and the fluctuation of amplitude is smaller. According to Fig. 6, the set of to can be used as the filtered signal. The quantitative mean used to automatically identify the relevant IMFs will be an important content of future research.
Figure 5.EEMD result of the experimental SMI signal.
The envelope of the filtered SMI signal is calculated by Hilbert transform, as shown by the dotted line in Fig. 7(a). In the process of Hilbert transform, it is necessary to use the method of signal extension to suppress the end effect, so as to reduce the distortion at both ends of the envelope signal[21]. According to Eq. (8), the normalized SMI signal can be obtained by using the ratio of the filtered signal to the envelope signal, as shown in Fig. 7(b). According to the fringe counting method and interpolation method, the normalized SMI signal is used to reconstruct the displacement of the PZT, as shown in Fig. 7(c). The measurement error of displacement is shown in Fig. 7(d).
Figure 7.(a) Envelope of filtered SMI signal; (b) normalized SMI signal; (c) reconstructed displacement signal; (d) error of reconstruction displacement.
The results of displacement reconstruction are shown in Table 1. The maximum error of the reconstruction displacement of the algorithm in this Letter is 388.12 nm, and the standard deviation is 213.23 nm.
The laser SMI technique is used to measure the displacement of the linear displacement table with bidirectional repeatability period of . The displacement is set at . The experimental SMI signal and its derivative are shown in Fig. 8. Due to the influence of the speckle effect, the amplitudes of the SMI signal and its derivative fluctuate greatly, which affects the subsequent displacement measurement. According to the derivative in Fig. 8(b), it is difficult to determine a suitable threshold to detect the interference fringes. Therefore, it is necessary to filter and normalize the experimental signal before displacement reconstruction.
Figure 8.(a) Experimental SMI signal of linear displacement table; (b) derivative of experimental SMI signal.
The EEMD method is used to filter out the high-frequency noise and low-frequency noise in the experimental signal. The envelope of the filtered signal obtained by Hilbert transform is shown as the dotted line in Fig. 9(a). The normalized SMI signal and its derivative are shown in Figs. 9(b) and 9(c). The reconstructed displacement signal is shown in Fig. 9(d). As shown in Fig. 9(e), the relative error of reconstruction displacement is . The main factors affecting the accuracy of displacement measurement include fringe loss caused by a low level of optical feedback, stability of the laser wavelength, and operation accuracy of the linear displacement table.
Figure 9.(a) Envelope of filtered SMI signal; (b) normalized SMI signal; (c) derivative of normalized SMI signal; (d) reconstructed displacement signal; (e) relative error of reconstruction displacement.
In this Letter, a displacement measurement method based on SMI in the presence of speckle is proposed. EEMD is used to filter the SMI signal, and the Hilbert transform is used to extract the envelope signal. The SMI signal is transformed into the standard signal by normalization, and the displacement is reconstructed by the fringe counting method. The experimental results of PZT displacement measurement show that the method can accurately calculate the number of interference fringes under the condition of the speckle effect. The experimental results show that when the displacement of the linear displacement table is , the relative error of displacement measurement is . The experimental results verify the correctness and feasibility of the method.
Yan Zhao, Haiwei Zhang. Displacement measurement method based on laser self-mixing interference in the presence of speckle[J]. Chinese Optics Letters, 2020, 18(5): 051201