
Lianzhe Wang, Jungang Han, Sheng Lu, Haipeng Tang, Quan Qi, Ningyu Feng, Shaojie Tang. Fast Reconstruction Algorithm of Point Cloud Implicit Surface[J]. Laser & Optoelectronics Progress, 2021, 58(4): 0415003
- Laser & Optoelectronics Progress
- Vol. 58, Issue 4, 0415003 (2021)
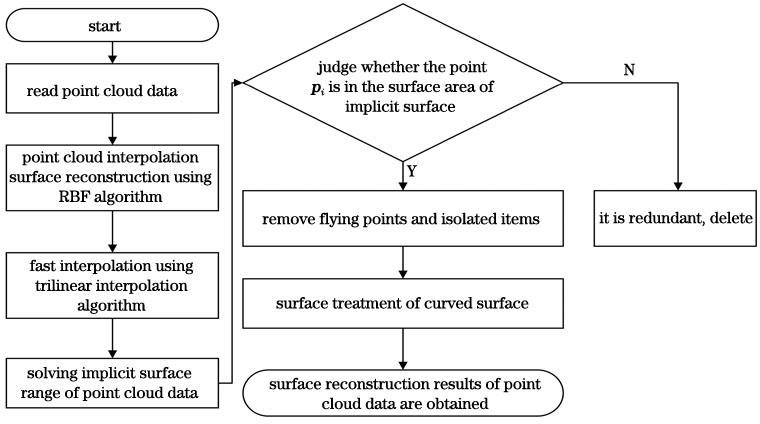
Fig. 1. Flow chart of fast reconstruction algorithm for point cloud implicit surface
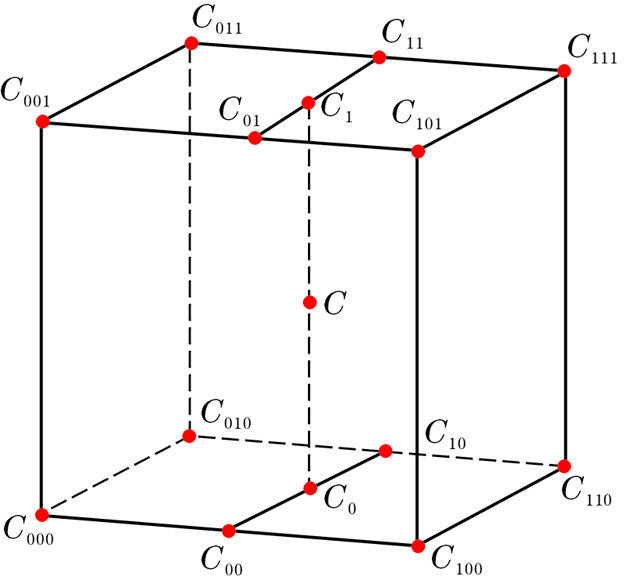
Fig. 2. Interpolation process of point C in space
Fig. 3. Surface area of point cloud
Fig. 4. Statistical filtering and denoising flow chart
Fig. 5. Facial point cloud and head point cloud are shown. (a) Facial point cloud positive perspective; (b) right perspective of facial point cloud; (c) head point cloud frontal view; (d) side view of head point cloud; (e) left view of Bunny point cloud; (f) right view of Bunny point cloud
Fig. 6. Head point cloud reconstruction results contrast. (a)(c) Reconstruction result of method in Ref. [6]; (b)(d) reconstruction result when interval step size of algorithm in this paper is set to 6
Fig. 7. Comparison of head point cloud interpolation results in scatter plots. (a) Interpolation result of original RBF algorithm; (b) interpolation result of algorithm in this paper
Fig. 8. Facial point cloud interpolation and reconstruction results were obtained by using the method in Ref.[6]. (a) Interpolation result of facial point cloud data; (b) reconstruction result of facial point cloud surface
Fig. 9. Interpolation and reconstruction results of the proposed algorithm. (a) Interpolation result of the proposed algorithm; (b) surface reconstruction result of algorithm in this paper; (c) local magnification of facial point cloud surface reconstruction result; (d) surface reconstruction result of Stanford Bunny point cloud
Fig. 10. Curves of reconstruction time and deviation of point cloud data surface at different sampling step sizes. (a)Curve of point cloud on head; (b) curve of point cloud on face
Fig. 11. Deviation evaluation diagram of point cloud interpolation results in ImageWare. (a) Head point cloud; (b) positive view of facial point cloud; (c) side view of facial point cloud
| ||||||||||||||||||||||||||||||||||||||||||||||||||||||||||||||||||||||||||||||||||||||||||||||||||||||||||||||||||||||||||||||||||||||||||
Table 1. Interpolation operation time of point cloud data selected in experiment

Set citation alerts for the article
Please enter your email address
© Copyright 2018-2021 | Chinese Laser Press. All Rights Reserved 沪ICP备15018463号-20