• Laser & Optoelectronics Progress
  • Vol. 59, Issue 8, 0828005 (2022)
Shutao Wang1, Wang Kang1、*, Deming Kong1, Tiezhu Wang1, and Ruixiang Li2
Author Affiliations
  • 1Key Laboratory of Measurement and Measurement Technology and Instruments, Electrical Engineering College,Yanshan University, Qinhuangdao , Hebei 066004, China
  • 2School of Surveying and Land Information Engineering, Henan Polytechnic University, Jiaozuo , Henan 454003, China
  • show less
    DOI: 10.3788/LOP202259.0828005 Cite this Article Set citation alerts
    Shutao Wang, Wang Kang, Deming Kong, Tiezhu Wang, Ruixiang Li. GF-1 Image Fusion Based on Regression Kriging[J]. Laser & Optoelectronics Progress, 2022, 59(8): 0828005 Copy Citation Text show less
    Flow chart of proposed method
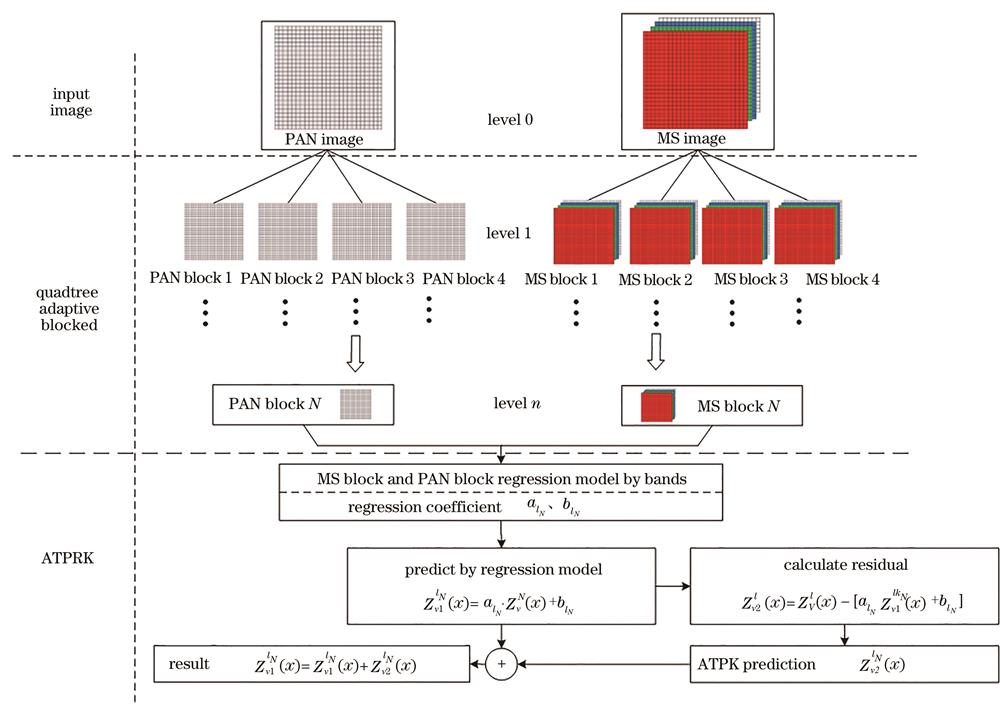
    Fig. 1. Flow chart of proposed method
    Experiment GF-1 image and location of selected experimental area
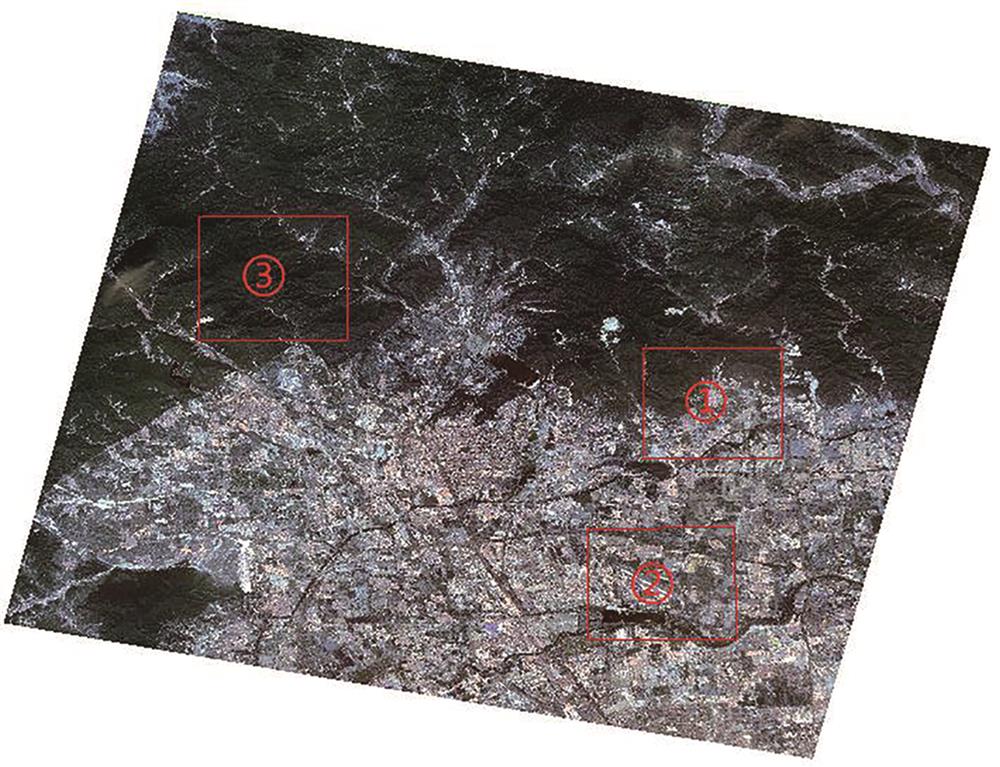
    Fig. 2. Experiment GF-1 image and location of selected experimental area
    Region 1 fusion results of each algorithm. (a) Source data; (b) PAN image; (c) IGS; (d) PCA; (e) WaveLets; (f) DenseNet; (g) ATPRK; (h) proposed algorithm
    Fig. 3. Region 1 fusion results of each algorithm. (a) Source data; (b) PAN image; (c) IGS; (d) PCA; (e) WaveLets; (f) DenseNet; (g) ATPRK; (h) proposed algorithm
    Region 2 fusion results of each algorithm. (a) Source data; (b) PAN image; (c) IGS; (d) PCA; (e) WaveLets; (f) DenseNet;(g) ATPRK; (h) proposed algorithm
    Fig. 4. Region 2 fusion results of each algorithm. (a) Source data; (b) PAN image; (c) IGS; (d) PCA; (e) WaveLets; (f) DenseNet;(g) ATPRK; (h) proposed algorithm
    Region 3 fusion results of each algorithm. (a) Source data; (b) PAN image; (c) IGS; (d) PCA; (e) WaveLets; (f) DenseNet;(g) ATPRK; (h) proposed algorithm
    Fig. 5. Region 3 fusion results of each algorithm. (a) Source data; (b) PAN image; (c) IGS; (d) PCA; (e) WaveLets; (f) DenseNet;(g) ATPRK; (h) proposed algorithm
    Local amplification of fusion results of each algorithm.(a) Source data; (b) PAN image; (c) IGS; (d) PCA; (e) WaveLets;(f) DenseNet; (g) ATPRK;(h) proposed algorithm
    Fig. 6. Local amplification of fusion results of each algorithm.(a) Source data; (b) PAN image; (c) IGS; (d) PCA; (e) WaveLets;(f) DenseNet; (g) ATPRK;(h) proposed algorithm
    IndexBandIdealIGSPCAWaveLetsDenseNetATPRKProposed algorithm
    RMSER00.01840.03580.01740.01480.01210.0092
    G00.01970.04240.0180.0160.01570.0125
    B00.01930.05030.01790.01180.01740.0137
    NIR00.01950.0060.11480.01190.01130.0124
    Mean00.01920.03360.04200.01360.01410.0118
    SSIMR10.93530.14740.95730.93070.98080.9842
    G10.94500.17770.96630.90140.97760.9787
    B10.95400.16160.97270.94050.97970.9822
    NIR10.95210.99180.8270.89840.9810.9805
    Mean10.94660.36960.93080.91780.97980.9817
    UIQIR10.49030.52690.87060.93450.9130.9442
    G10.50420.54150.89920.91630.90080.9304
    B10.61370.53760.93160.93520.920.9513
    NIR10.54550.99250.81190.95710.93720.9322
    Mean10.53840.64960.87830.93580.91780.9394
    ERGAS09.976821.33024.5416.46787.79836.1853
    SAM01.21794.917613.3801.22541.4331.2354
    Table 1. Results of image quality evaluation in experimental region 1
    IndexBandIdealIGSPCAWaveLetsDenseNetATPRKProposed algorithm
    RMSER00.01830.0340.01790.00960.01140.0095
    G00.01950.04120.01840.01360.01570.0125
    B00.01920.04510.01820.01010.01590.0132
    NIR00.01950.01190.0940.01130.01760.0125
    Mean00.01910.03300.03710.01120.01520.0118
    SSIMR10.95840.27790.98030.95070.97220.9954
    G10.96420.3080.98510.96380.96770.9941
    B10.96840.3510.98770.94610.97060.9949
    NIR10.96370.9450.70770.98480.96510.9948
    Mean10.96370.47050.91520.96140.96890.9949
    UIQIR10.89030.44610.86870.92650.9230.9428
    G10.91770.47340.90710.96340.90570.9442
    B10.94040.51840.93080.93680.9280.9515
    NIR10.92330.96530.81480.97690.8930.9637
    Mean10.91790.60080.88030.95090.91240.9503
    ERGAS09.699519.06521.8197.10797.73726.0844
    SAM01.24043.50799.82721.35061.62041.1741
    Table 2. Results of image quality evaluation in experimental region 2
    IndexBandsIdealIGSPCAWaveLetsDenseNetATPRKProposed algorithm
    RMSER00.01260.00710.01230.00740.00250.0026
    G00.01330.00640.01250.00660.00460.0046
    B00.01320.00970.01250.00880.00430.0048
    NIR00.01820.04090.08190.01250.0130.0101
    Mean00.01430.01600.02980.00880.00610.0055
    SSIMR10.83690.55150.91430.98140.98980.9964
    G10.88740.81440.95510.97470.98470.9945
    B10.88330.58890.95080.99210.98660.9954
    NIR10.93680.21240.84260.98140.98330.9942
    Mean10.88610.54180.91570.98240.98610.9952
    UIQIR10.63440.78550.63180.90250.92540.9191
    G10.62470.89330.73670.92560.90510.8983
    B10.65760.80370.76560.89590.91760.922
    NIR10.76370.60.66950.93870.9360.9611
    Mean10.67010.77060.70090.91570.92100.9248
    ERGAS010.2329.812934.9573.78473.82493.5724
    SAM01.73344.505227.8731.10541.09470.8931
    Table 3. Results of image quality evaluation in experimental region 3
    Shutao Wang, Wang Kang, Deming Kong, Tiezhu Wang, Ruixiang Li. GF-1 Image Fusion Based on Regression Kriging[J]. Laser & Optoelectronics Progress, 2022, 59(8): 0828005
    Download Citation