• Chinese Optics Letters
  • Vol. 14, Issue 6, 060101 (2016)
Lihui Lv1、2, Wenqing Liu1、2, Guangqiang Fan1, Tianshu Zhang1、*, Yunsheng Dong1, Zhenyi Chen1, Yang Liu1、2, Haoyun Huang3, and Yang Zhou3
Author Affiliations
  • 1Key Laboratory of Environmental Optics and Technology, Anhui Institute of Optics and Fine Mechanics, Chinese Academy of Sciences, Hefei 230031, China
  • 2University of Science and Technology of China, Hefei 230026, China
  • 3Tianjin Key Laboratory of Air Pollution Prevention and Control, Tianjin Academy of Environmental Sciences, Tianjin 300191, China
  • show less
    DOI: 10.3788/COL201614.060101 Cite this Article Set citation alerts
    Lihui Lv, Wenqing Liu, Guangqiang Fan, Tianshu Zhang, Yunsheng Dong, Zhenyi Chen, Yang Liu, Haoyun Huang, Yang Zhou. Application of mobile vehicle lidar for urban air pollution monitoring[J]. Chinese Optics Letters, 2016, 14(6): 060101 Copy Citation Text show less
    Schematic diagram of mobile lidar.
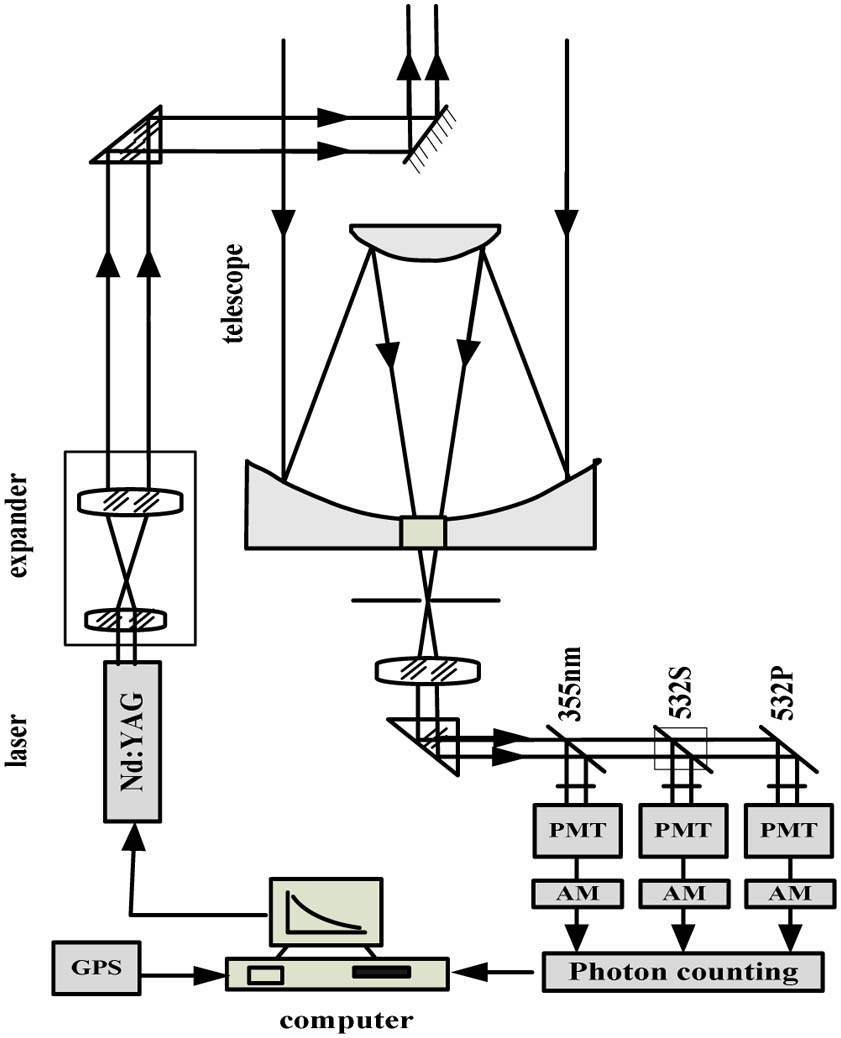
    Fig. 1. Schematic diagram of mobile lidar.
    Atmospheric haze pollution mobile monitoring vehicle.
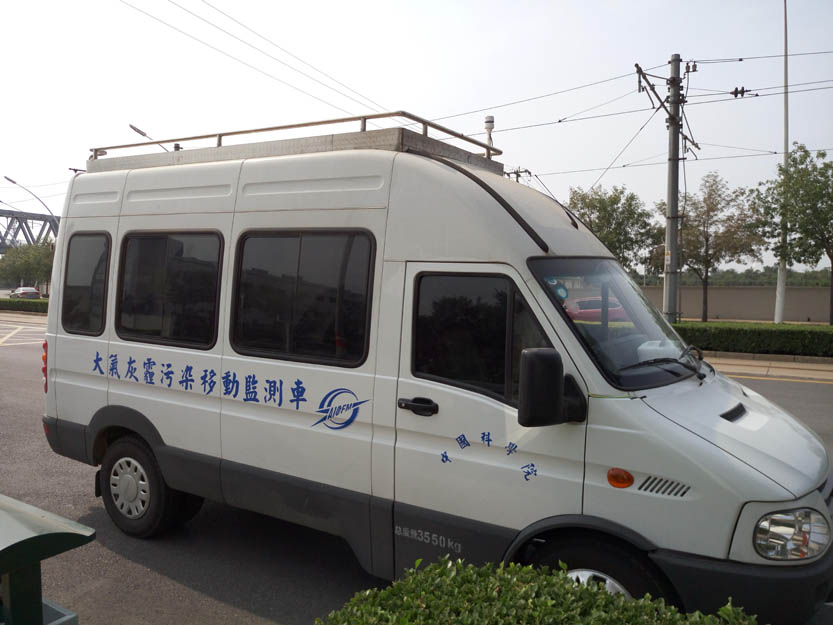
    Fig. 2. Atmospheric haze pollution mobile monitoring vehicle.
    Route of mobile vehicle lidar observation.
    Fig. 3. Route of mobile vehicle lidar observation.
    Spatial distribution of aerosol extinction of 532 nm (a) September 21, 2015, 20:00–20:53 CST, and (b) September 22, 2015, 9:00–10:00 CST.
    Fig. 4. Spatial distribution of aerosol extinction of 532 nm (a) September 21, 2015, 20:00–20:53 CST, and (b) September 22, 2015, 9:00–10:00 CST.
    Comparison of aerosol profiles on September 21 and 22, 2015.
    Fig. 5. Comparison of aerosol profiles on September 21 and 22, 2015.
    Depolarization ratio profiles at 117.71°E, 39.08°N during the experimental period.
    Fig. 6. Depolarization ratio profiles at 117.71°E, 39.08°N during the experimental period.
    Time sequence plots of aerosol measured by a ground-based lidar.
    Fig. 7. Time sequence plots of aerosol measured by a ground-based lidar.
    Variations of PM2.5 and PM10 concentrations in the experimental period.
    Fig. 8. Variations of PM2.5 and PM10 concentrations in the experimental period.
    Local wind direction and speed data during the experimental period.
    Fig. 9. Local wind direction and speed data during the experimental period.
    Distribution of aerosol extinction coefficients at the height of 300 m on (a) September 21, 2015, and (b) September 22, 2015.
    Fig. 10. Distribution of aerosol extinction coefficients at the height of 300 m on (a) September 21, 2015, and (b) September 22, 2015.
    Backward trajectory ending at BNAT, at 15:00 UTC on September 23, 2015.
    Fig. 11. Backward trajectory ending at BNAT, at 15:00 UTC on September 23, 2015.
     FeatureSpecification
    TransmitterLaserNd:YAG
    Wavelength532 nm, 355 nm
    Pulse energy25 mJ (532 nm); 30 mJ (355 nm)
    Repetition frequency20 Hz
    Divergence0.2 mrad
    ReceiverTelescopeCassegrain
    Diameter200 mm
    DetectorPMT
    Range resolution7.5 m
    Table 1. Key Specifications of the Mobile Vehicle Lidar System
    Lihui Lv, Wenqing Liu, Guangqiang Fan, Tianshu Zhang, Yunsheng Dong, Zhenyi Chen, Yang Liu, Haoyun Huang, Yang Zhou. Application of mobile vehicle lidar for urban air pollution monitoring[J]. Chinese Optics Letters, 2016, 14(6): 060101
    Download Citation