Lihui Lv, Wenqing Liu, Guangqiang Fan, Tianshu Zhang, Yunsheng Dong, Zhenyi Chen, Yang Liu, Haoyun Huang, Yang Zhou, "Application of mobile vehicle lidar for urban air pollution monitoring," Chin. Opt. Lett. 14, 060101 (2016)
Copy Citation Text
A mobile vehicle lidar system has been developed and applied to detect urban air quality. On September 21 and 22, 2015, particulate matter observation with mobile vehicle lidar was carried out in the Binhai New Area of Tianjin. Combined with the latitude and longitude information acquired by a GPS, the three-dimensional distribution of the aerosol extinction coefficient was presented in the experimental area. Furthermore, the source, distribution, and the transportation path of the aerosols in the area were investigated based on lidar data, local meteorological data, and backward trajectory analysis. The results show that mobile vehicle lidar can detect the atmospheric aerosols and reflect the stereoscopic distribution properties of aerosols. The potential of this vehicle lidar system provides a new scientific basis for the study of the source, distribution, and transportation of atmospheric particles.
In recent years, with the acceleration of economic development and urbanization, the pollution of atmospheric particles in China has become more and more serious[1]. Atmospheric aerosols have remarkable impacts on human health, traffic safety, and climate change[2–4]. Therefore, the study of atmospheric particles is very important. Lidar is a kind of power tool for aerosol monitoring with the advantages of high resolution and accuracy, especially in continuous operation. With the rapid development of laser technology and photoelectric detection technology, lidar has been widely used in the exploration and research of atmospheres[5–8].
At present, ground-based lidar has been widely used[9–12]. However, the monitoring sites are limited, as the equipment is expensive, and regional variability is difficult to assess from the point measurements alone. In contrast, vehicle lidar has a special mobile platform, so it can make up the deficiency of the traditional ground-based lidar on a regional scale. A mobile vehicle lidar system makes air pollution monitoring in industrial and urban areas possible. The data collected by mobile vehicle lidar has the advantages of continuity on a regional scale. The vehicle lidar can obtain the distribution of aerosols in a large area and reflect the macro-distribution of pollutants in different scales. Thus, it can provide important information for the stereo monitoring of air pollution.
In this Letter, the observation of atmospheric aerosols over the Binhai New Area of Tianjin (BNAT) was carried out by a mobile vehicle lidar system and global positioning technology. Furthermore, more in-depth studies were presented and combined with ground-based lidar data, local meteorological information, and back trajectories from the Hybrid Single-Particle Lagrangian Integrated Trajectory (HYSPLIT) model. The results showed that mobile vehicle lidar can be used for pollution monitoring in a large-scale area.
Sign up for Chinese Optics Letters TOC. Get the latest issue of Chinese Optics Letters delivered right to you!Sign up now
Dual-wavelength lidar is a powerful tool to study the atmosphere’s properties and constituents. Lidar utilizes the echo signals generated by the interaction of the laser and atmosphere to obtain the parameters of aerosol particules. The laser is absorbed and scattered by the molecules and aerosol particles in the air when it is transmitting in the atmosphere. The optical parameters of the aerosol particles can be retrieved by the backscattering signals. Then, the vertical profiles of the aerosol extinction coefficient and linear depolarization ratio can be obtained.
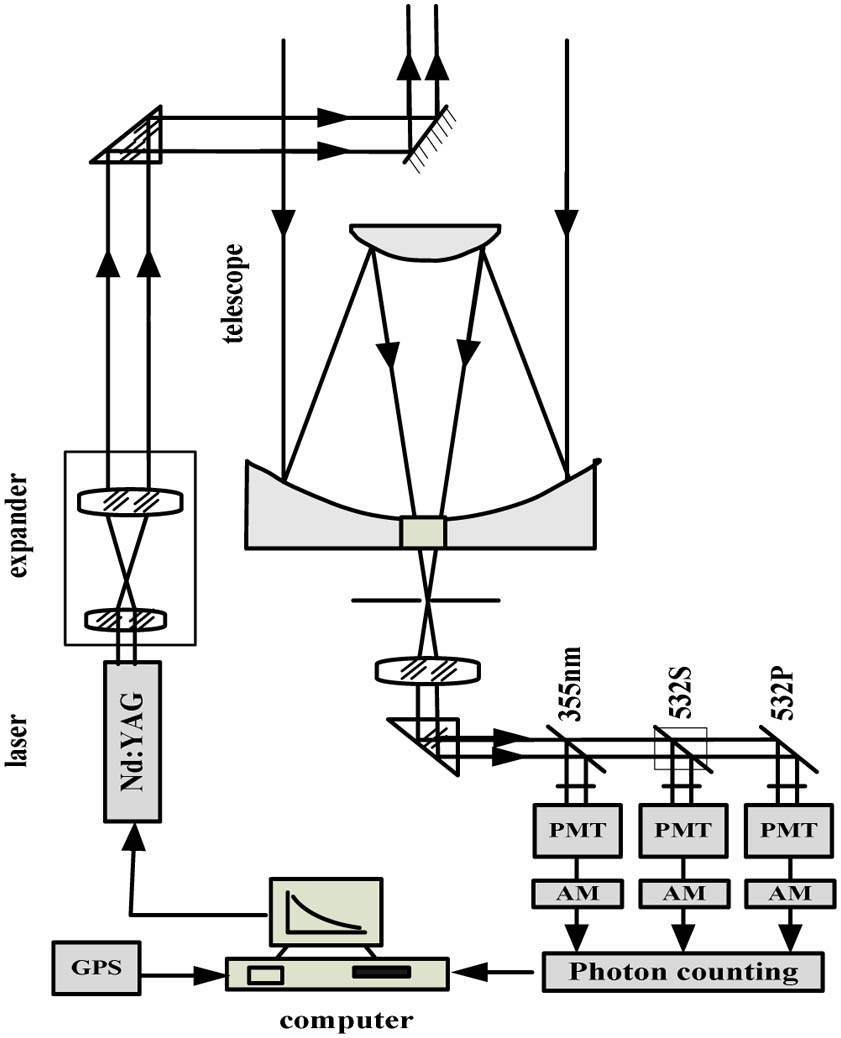
The mobile lidar system uses a vehicle as the carrier. The self-developed vehicle lidar is made up of four subunits: the emitting unit, receiving unit, signal acquisition unit, and GPS unit. The lidar measures elastically backscattered light at 532 and 355 nm. The linear depolarization ratio is derived from the cross-polarized and co-polarized signals at 532 nm. A schematic diagram of the vehicle lidar system is shown in Fig. 1. The laser is emitted into the atmosphere vertically, and then the echo signals are collected by a telescope. The laser source is a pulsed Nd:YAG solid laser emitting short pules at 532 and 355 nm. The pulse repetition rate is 20 Hz, and the pulse duration is about 9 ns. The receiving telescope of the system is based on a Cassegrain design. The range resolution of the lidar is 7.5 m. The vehicle equipped with lidar is shown in Fig. 2, and the key specifications of the mobile lidar system are given in Table 1.
On September 21 and 22, 2015, an experiment was carried out in the BNAT, China (39.03°N, 117.68°E). The BNAT is located on the coast of the Bohai Sea. With its rapid economical growth as the central zone of the Bohai economic circle, in BNAT, low visibility and sustained pollution are becoming more and more prominent. In order to get the temporal and spatial distributions and transportation paths of the pollutants, we used the vehicle-borne lidar system to carry out mobile observations in this area.
The mobile instrument moved along the highway near the Tianjin port to acquire the aerosol distribution on the monitoring path. The route of the mobile vehicle lidar is shown in red in Fig. 3. The full length of the route was about 24 km, and it took nearly 1 h to finish the route. In the observation period, GPS was used to record the position information in real time.
Figure 3.Route of mobile vehicle lidar observation.
The lidar equation for the elastic signal can be written as where is the received elastic signal at the height of , is a constant of the system, represents the height from the ground, and are the aerosol backscatter coefficient and molecular backscatter coefficient, respectively, and are the aerosol extinction coefficient and molecular extinction coefficient, respectively. According to the widely used Klett–Fernald[13] inversion algorithm, the solution of the aerosol extinction coefficient can be written as where is the aerosol extinction-to-backscattering ratio, . The corresponding ratio for the molecular is the constant .
It is convenient to calculate the linear depolarization ratio. It can be directly derived from the cross-polarized () and co-polarized () signals when the calibration factor is known:
Figure 4 presents the spatial distribution of the aerosol extinction (0.1–3 km) at 532 nm. It shows that a relatively stable pollution layer existed over the observed area and its height decreased gradually. The pollution near the ground was aggregating gradually in the area.
Figure 4.Spatial distribution of aerosol extinction of 532 nm (a) September 21, 2015, 20:00–20:53 CST, and (b) September 22, 2015, 9:00–10:00 CST.
The comparison of aerosol profiles at the same location of the two observations are shown in Fig. 5. It further indicates that the pollution near the ground was deteriorating, and the height of the stable pollution layer slumped from 2.0 km on the night of September 21 to 1.5 km in the morning of September 22. Additionally, Fig. 6 shows that the maximum depolarization ratio even reached to 0.3 on September 22. So the particles at the height of 0.8 km mainly consisted of irregular coarse particles, which may be derived from the local dust or external transportation.
Figure 5.Comparison of aerosol profiles on September 21 and 22, 2015.
Figure 7 illustrates the time sequence plots of the aerosol extinction coefficient at 532 nm by ground-based Raman lidar, which was placed in Tai Fung Park (117.72E, 39.04N) in BNAT. The variations of PM2.5 and PM10 concentrations (Fig. 8) from in-situ measurements in the environmental monitoring station of the area (117.69E, 39.03N) show a simultaneous increase of the PM2.5 and PM10. Specifically, Fig. 7 also shows that a pollution layer gradually sank and gathered near the ground, forming serious pollution at the night of September 22. The result is consistent with the result measured by the mobile vehicle lidar, and the height of the pollution layer is also in agreement with the result of the mobile lidar. All the results indicate that the mobile vehicle lidar has a certain reliability in the stereo monitoring of particulate matters.
Figure 9 shows the hourly wind direction and wind speed data in the observation period. It shows that the winds during the experimental period were mainly from the northwest and southwest. The wind direction was southwest during the first observation on September 21 and shifted to the northwest during the second observation on September 22. Taking the wind data into consideration, we find that the distribution of particles is highly related to the meteorological conditions. The high concentration of particles often occurs at the wind direction during the experimental period. Figure 10 presents the distribution of the aerosol extinction coefficients (at the height of 300 m) in different directions measured by the mobile vehicle lidar. It shows that the extinction coefficient near the inland side is higher than the side closer to the ocean, and the extinction coefficient in the southwest is significantly higher than those in the other directions. Further, combined with the meteorological data showed in Fig. 9, the southwest also happened to be the main wind direction during the experimental period. So the source of the pollutant in the southwest of BNAT is from exogenous transmission. The wind blew from the land to the ocean, with a speed of approximately 1 m/s, bringing the air masses from the more populated industrial area to the experimental area. The weak wind makes it difficult to spread the pollutants, leading to the pollution accumulation in the area. On the other hand, it suggests that the stagnant weather with weak wind and relatively low boundary layer height contributes more to the accumulation of aerosols[14].
Figure 7.Time sequence plots of aerosol measured by a ground-based lidar.
To further estimate the possible sources and transport pathways of aerosols, the back trajectory analysis from the HYSPLIT model is presented. The corresponding 72 h backward trajectory terminating at 1500 UTC on September 23 is shown in Fig. 11. The backward trajectory starting heights were fixed at 500, 1500, and 2500 m, which are widely used in the research of air transportation[15]. Figure 11 shows that during the experimental period, the aerosols below 1500 m were mainly from the southeast of China, where the air masses can be categorized as anthropogenic aerosol. This is possibly the other main origin of the fine particles besides the locally generated fine particles. The backward trajectory also shows that the air mass above 2000 m is transported from the higher altitude of the northwest direction. The air mass originated in the Kazakhstan Desert, passed through the Taklimakan Desert, and then fell down with the airflow near the experimental period, where it is categorized as sand aerosol. As a result, a serious composite pollution was formed by the interaction of the fine particles and coarse particles transported from the far distance.
Figure 11.Backward trajectory ending at BNAT, at 15:00 UTC on September 23, 2015.
In conclusion, the mobile vehicle lidar avoids the limitations of ground-based lidar, and it obtains the aerosol spatial distribution information with more detailed and accurate aerosol characteristics. In this Letter, the mobile vehicle lidar technology is used to detect the atmospheric aerosols of BNAT. The results show the distribution of the aerosol extinction during the experimental period. Furthermore, more comprehensive understandings (source and transportation path) of the particulate pollution in the area are discussed with the combination of lidar data, local meteorological data, and the HYSPLIT model. This typical pollution process occurring in BNAT is a mixed pollution caused by fine particles and coarse particles that come from the southeast and northwest of China, respectively. Additionally, we find that the distribution of particles is highly related to the meteorological conditions. The high concentration of particle often occurs at the wind directions, and the stable pollution layer decreases gradually to form the serious pollution near the ground in relatively stable weather. In the future, the mobile vehicle will be used to detect the flux and total amount of particulate matters coupled with wind profiles. It can be further utilized for the study of urban or regional particulate pollution.
Lihui Lv, Wenqing Liu, Guangqiang Fan, Tianshu Zhang, Yunsheng Dong, Zhenyi Chen, Yang Liu, Haoyun Huang, Yang Zhou, "Application of mobile vehicle lidar for urban air pollution monitoring," Chin. Opt. Lett. 14, 060101 (2016)