• Infrared and Laser Engineering
  • Vol. 51, Issue 2, 20210911 (2022)
Suying Lin, Xiaojie Liao, and Bing Han
Author Affiliations
  • School of Electronic and Optical Engineering, Nanjing University of Science and Technology, Nanjing 210094, China
  • show less
    DOI: 10.3788/IRLA20210911 Cite this Article
    Suying Lin, Xiaojie Liao, Bing Han. Nanosecond laser-induced periodic structures on polyimide film[J]. Infrared and Laser Engineering, 2022, 51(2): 20210911 Copy Citation Text show less
    Sketch for experimental set up
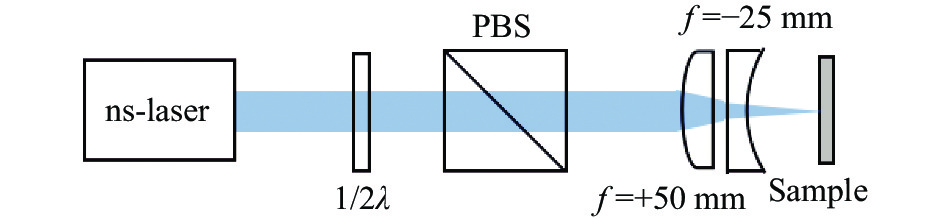
    Fig. 1. Sketch for experimental set up
    Classification of surface morphology under different fluence and pulse number
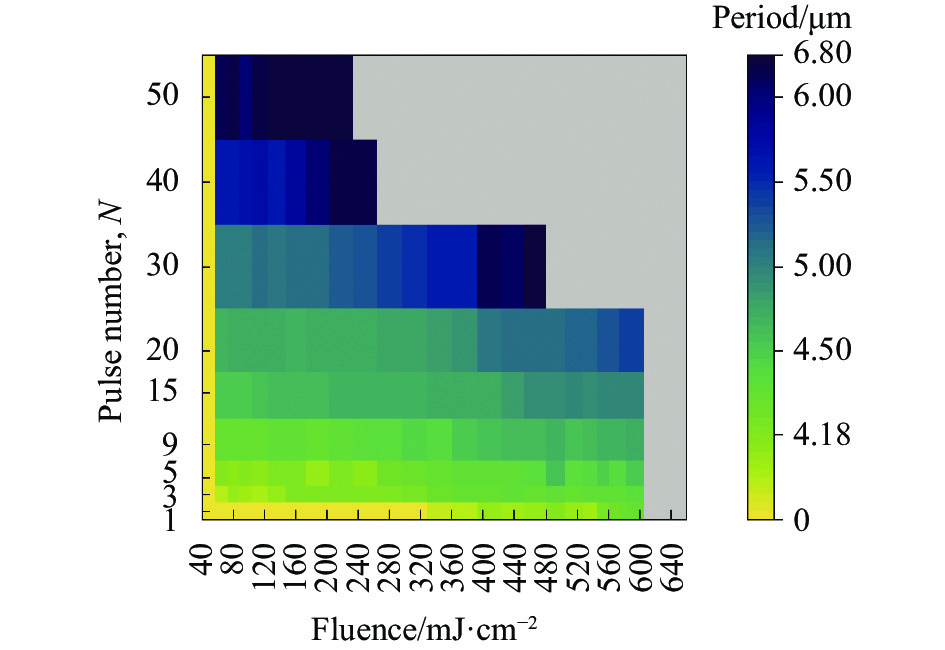
    Fig. 2. Classification of surface morphology under different fluence and pulse number
    (a) Surface optical microscope image when the laser fluence F= 0.187 J/cm2,pulse number N= 1, it shows the response of the material surface with disordered scattered points; (b) Surface optical microscope image when the laser fluence F= 0.345 J/cm2, pulse number N= 9, it shows the obvious LIPSS structure on the surface; (c) Surface optical microscope image when the laser fluence F= 0.248 J/cm2, pulse number N= 40, it means that the material is obviously ablated, but LIPSS still exists at the bottom of the ablation pit
    Fig. 3. (a) Surface optical microscope image when the laser fluence F= 0.187 J/cm2,pulse number N= 1, it shows the response of the material surface with disordered scattered points; (b) Surface optical microscope image when the laser fluence F= 0.345 J/cm2, pulse number N= 9, it shows the obvious LIPSS structure on the surface; (c) Surface optical microscope image when the laser fluence F= 0.248 J/cm2, pulse number N= 40, it means that the material is obviously ablated, but LIPSS still exists at the bottom of the ablation pit
    (a) Optical microscope image of material surfaces with the laser fluence is 345 mJ/cm2, pulse number N= 7; (b) AFM scanning diagram of the black frame part of figure (a); (c) Period and depth of the white line in figure (b); (d) Side view of the two-dimensional Fourier transform image of figure (a)
    Fig. 4. (a) Optical microscope image of material surfaces with the laser fluence is 345 mJ/cm2, pulse number N= 7; (b) AFM scanning diagram of the black frame part of figure (a); (c) Period and depth of the white line in figure (b); (d) Side view of the two-dimensional Fourier transform image of figure (a)
    (a) Fitting relationship between the fluence and fringe period, pulse number N= 5, 9, 15, 20, 30, 40; (b) When there is an approximate linear relationship between pulse number, period and fluence, the linear growth part is fitted, relationship between slope of fitting line and N; (c) Fitting diagram of the relationship between the lower limit and upper limit of LIPSS period and the pulse number obtained by changing the laser fluence under different pulse number
    Fig. 5. (a) Fitting relationship between the fluence and fringe period, pulse number N= 5, 9, 15, 20, 30, 40; (b) When there is an approximate linear relationship between pulse number, period and fluence, the linear growth part is fitted, relationship between slope of fitting line and N; (c) Fitting diagram of the relationship between the lower limit and upper limit of LIPSS period and the pulse number obtained by changing the laser fluence under different pulse number
    (a) Fitting relationship between pulse number and fringe period when laser fluence F= 94 mJ/cm2, F= 160 mJ/cm2, F= 248 mJ/cm2, F= 345 mJ/cm2, F= 467 mJ/cm2, F= 569 mJ/cm2; (b) Relationship between the growth rate of the period increasing with the pulse number and the fluence under different fluence obtained according to figure (a)
    Fig. 6. (a) Fitting relationship between pulse number and fringe period when laser fluence F= 94 mJ/cm2, F= 160 mJ/cm2, F= 248 mJ/cm2, F= 345 mJ/cm2, F= 467 mJ/cm2, F= 569 mJ/cm2; (b) Relationship between the growth rate of the period increasing with the pulse number and the fluence under different fluence obtained according to figure (a)
    Schematic diagram of the maximum depth at which the temperature rise can reach the melting point and glass transition temperature under different laser fluences
    Fig. 7. Schematic diagram of the maximum depth at which the temperature rise can reach the melting point and glass transition temperature under different laser fluences
    Time when the surface temperature of the material is maintained higher than the glass transition temperature and melting point
    Fig. 8. Time when the surface temperature of the material is maintained higher than the glass transition temperature and melting point
    ParameterDensity ρ/kg·m-3Thermal conductivity, k/W·m−1·K−1Specific heat capacity, c/J·kg−1·K−1Absorption coefficient, α/m−1
    Value14200.211382×106
    Table 1. Thermophysical parameters of PI
    Suying Lin, Xiaojie Liao, Bing Han. Nanosecond laser-induced periodic structures on polyimide film[J]. Infrared and Laser Engineering, 2022, 51(2): 20210911
    Download Citation