
Xiangsong ZHANG, Yetong LIU, Yongying WANG, Zirui WU, Zhenzhong LIU, Yi LI, Juan YANG. Self-assembled Platinum-iridium Alloy Aerogels and Their Efficient Electrocatalytic Ammonia Oxidation Performance [J]. Journal of Inorganic Materials, 2023, 38(5): 511
- Journal of Inorganic Materials
- Vol. 38, Issue 5, 511 (2023)
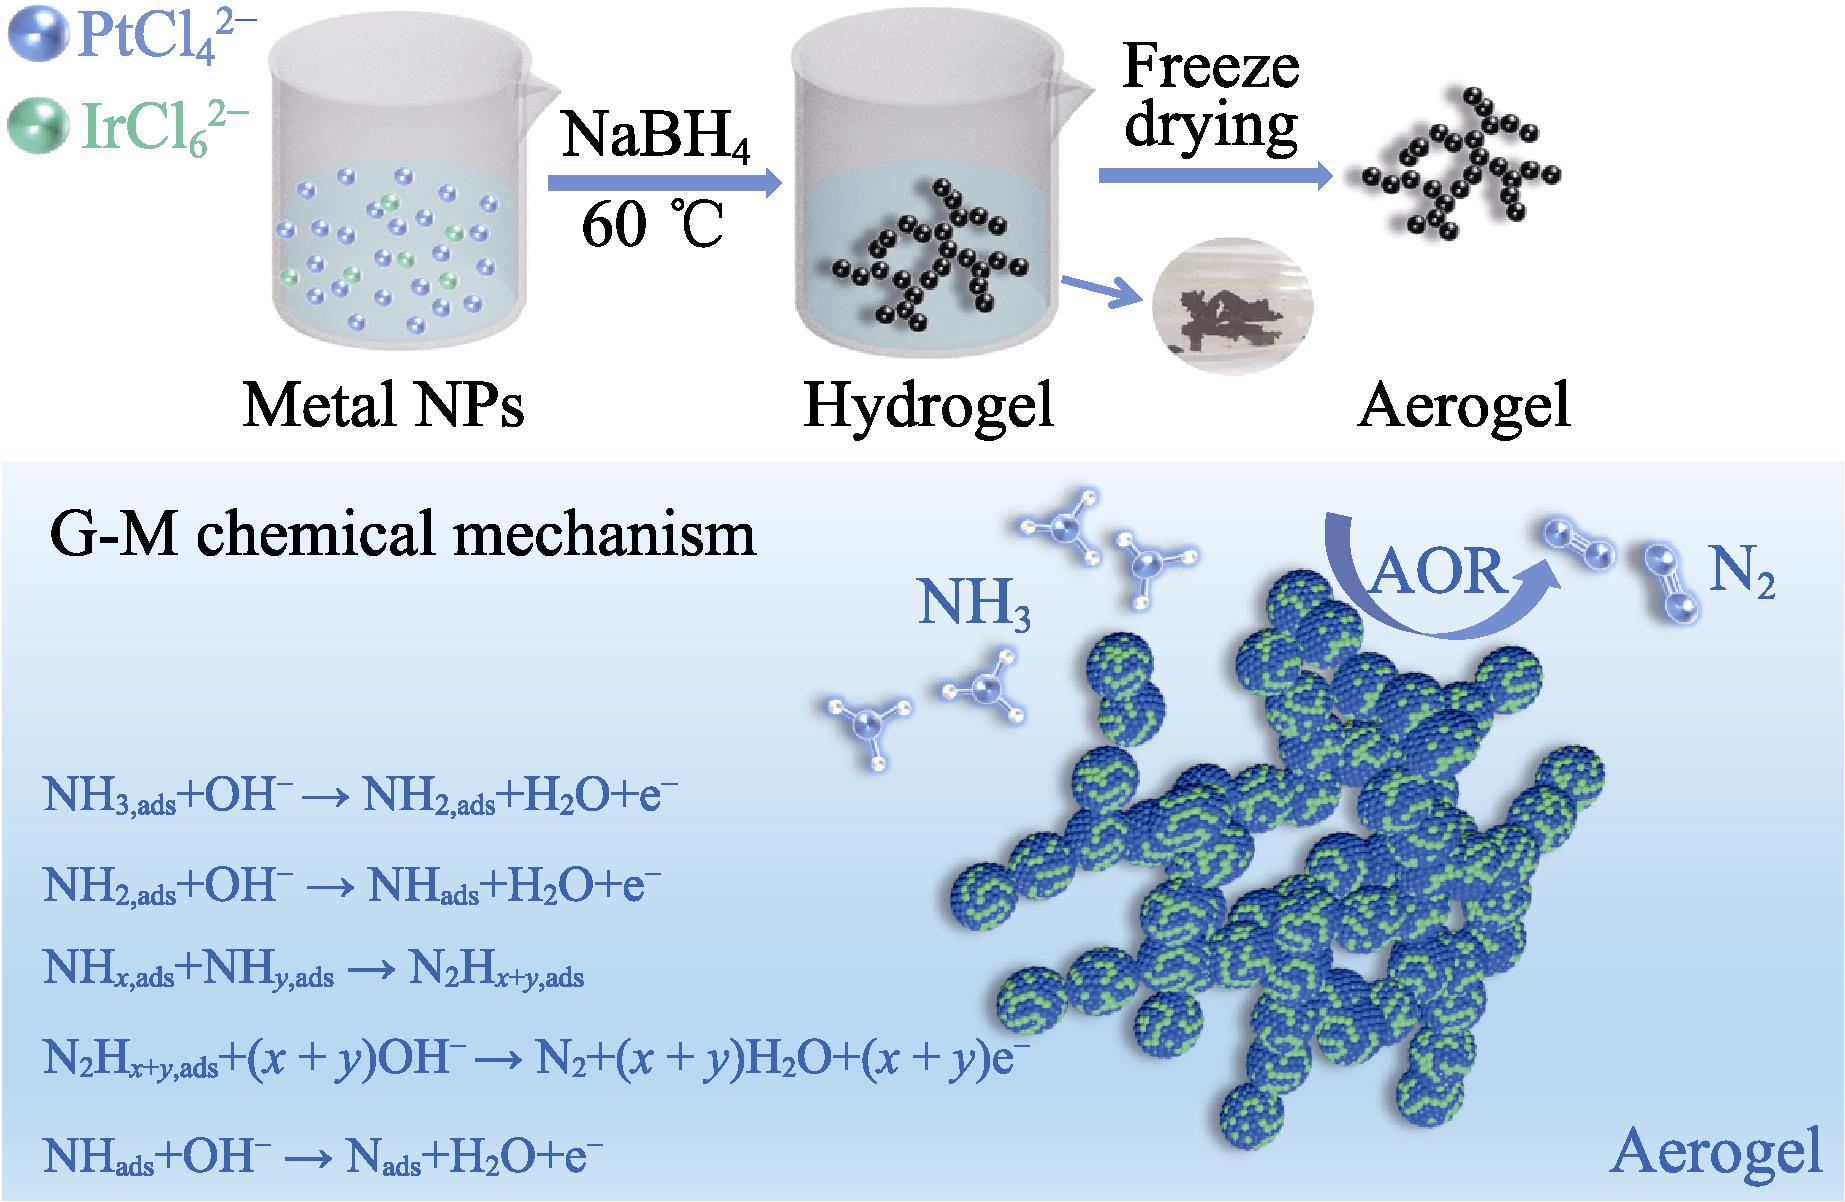
1. Diagram of preparation process and chemical mechanisms of Pt100-x Irx alloy aerogels
S1. SEM image of Pt80Ir20 aerogel
2. Structure and composition of Pt80Ir20 alloy aerogel
3. (a) XRD patterns of different catalysts, commercial Pt/C, and (b) corresponding enlarged XRD patterns in the range of 2θ =35°-50°
4. (a) XPS survey spectrum of Pt80Ir20 aerogel, (b) Pt4f XPS spectra of various Pt-based catalysts, and (c) Ir4f XPS spectrum of Pt80Ir20 aerogel
S2. TEM images of Pt aerogel
S3. TEM images of Pt80Ir20 alloy
5. (a) CV curves of Pt100-x Irx aerogels and commercial Pt/C catalysts under room temperature, (b) AOR activity comparison for Pt100-x Irx aerogels and commercial Pt/C catalysts at 0.5 V(vs. RHE), (c) energy difference between the highest occupied molecular orbital (HOMO) and the lowest unoccupied molecular orbital (LUMO) of Pt, Ir and Pt80Ir20 nanoparticles, (d) schematic diagram of electrocatalytic ammonia oxidation of Pt80Ir20 alloy nanoparticles and Pt80Ir20 alloy aerogel, (e) CV curves of the Pt80Ir20 catalyst in the presence and absence of NH3; (f) CA curves of Pt100-x Irx aerogels and commercial Pt/C catalysts
6. Electrochemical active areas of catalysts and AOR performance before and after 2000 CV cycles
S4. EDS spectrum of Pt80Ir20 aerogel catalyst with inset showing its mass and atom ratios
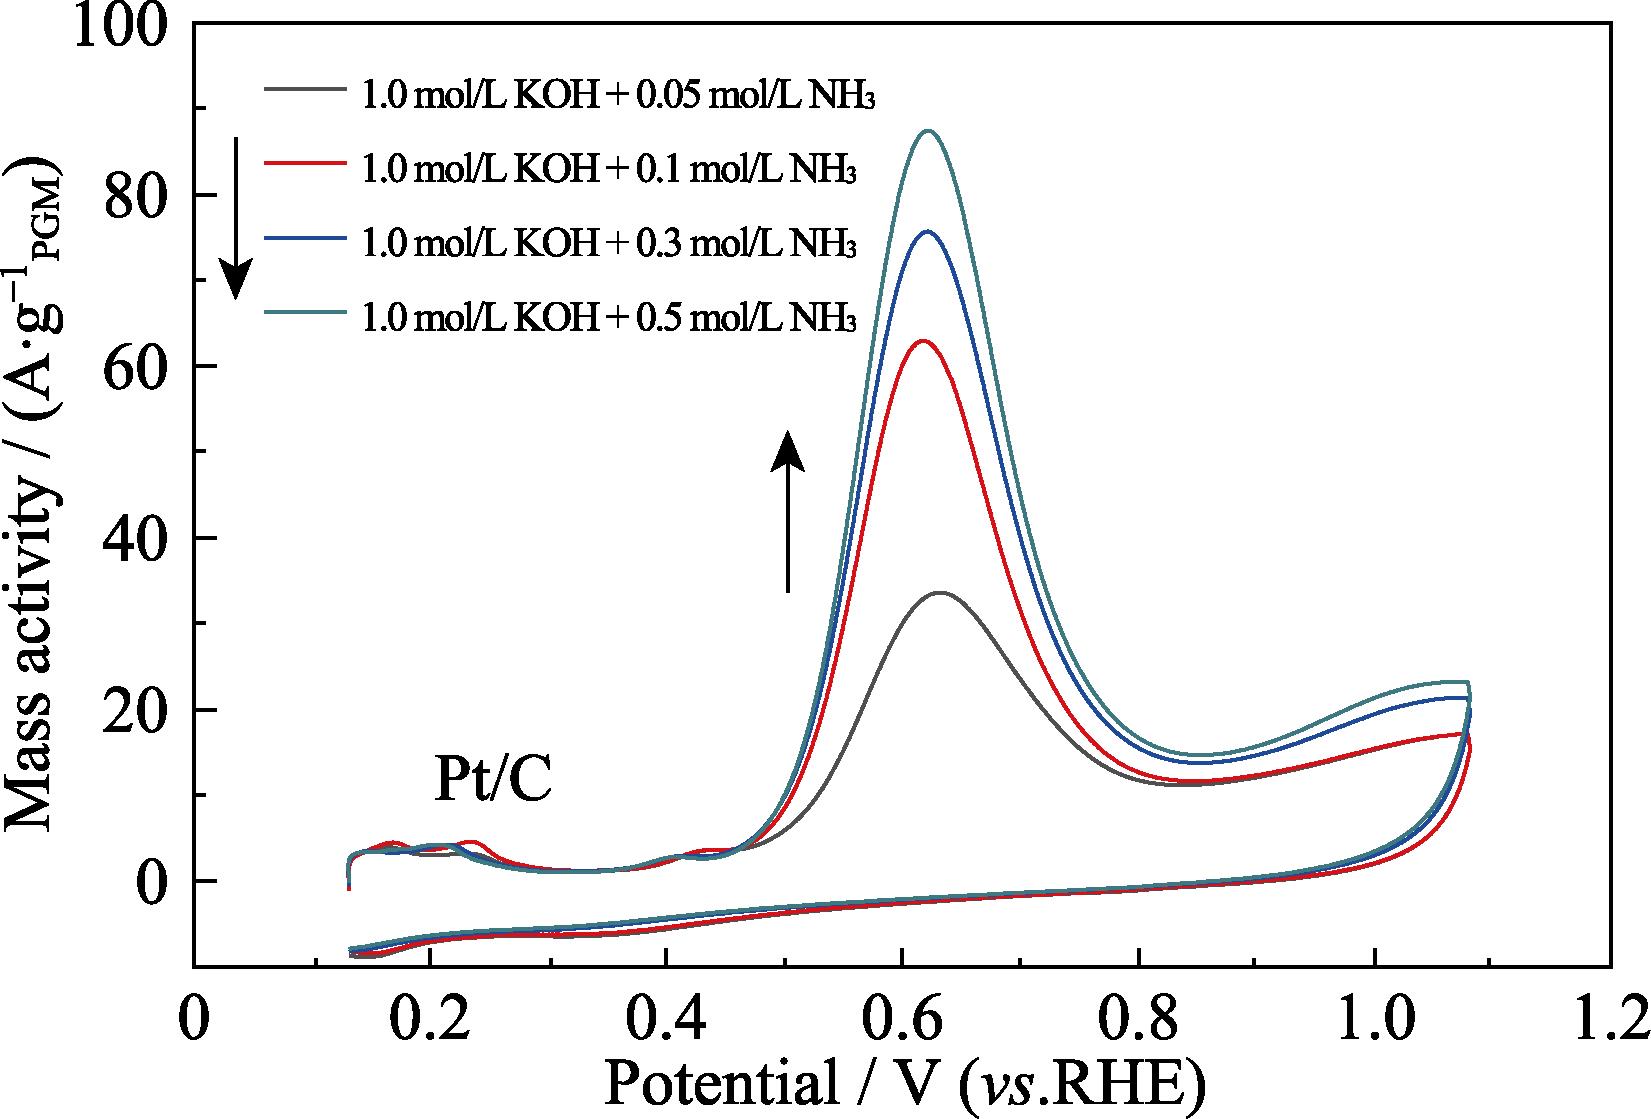
7. (a) CV curves of the Pt80Ir20 aerogel tested in different NH3 concentrations, (b) AOR activity comparison for Pt80Ir20 aerogel and commercial Pt/C in different NH3 concentrations at 0.5 V(vs. RHE), and (c, d) CA curves of the Pt80Ir20 aerogel (c) and commercial Pt/C (d) at 0.65 V(vs. RHE)
8. (a-c) CV curves of catalysts at different temperatures, (d) AOR activity comparison for commercial Pt/C, Pt aerogel and Pt80Ir20 aerogel catalysts at different temperatures at 0.5 V(vs. RHE), (e) CA curves of the Pt80Ir20 aerogel at different temperatures at 0.65 V (vs. RHE), (f) Arrhenius plots for NH3 oxidation on commercial Pt/C, Pt aerogel and Pt80Ir20 aerogel catalysts at 0.5 V(vs. RHE)
S5. Electrochemical active surface area of Pt, Pt80Ir20 aerogels
S6. Nyquist plots of EIS spectra measured for Pt (violet), Pt80Ir20 aerogel (blue) and commercial Pt/C (gray) in 1.0 mol/L KOH electrolyte at the open circuit potential
S7. XRD patterns of Pt80Ir20 aerogel before and after 2000 cycle stability tests
S8. TEM images of Pt80Ir20 aerogel
S9. CV curves of the commercial Pt/C in different NH3 concentrations
|
Table 1. Elemental quantification (%, in atom) determined by XPS for different Pt100-xIrx aerogel catalysts
|
Table 2. Comparison of binding energy between Pt4f with different Pt-based catalysts
|
Table 3. Comparison of AOR activity between different catalysts


Set citation alerts for the article
Please enter your email address

© Copyright 2018-2021 | Chinese Laser Press. All Rights Reserved 沪ICP备15018463号-20