
Qiushuang Zhao, Liming Zhao. Effect of fabrication errors on multiple second-harmonic generation considering the pump depletion[J]. Chinese Optics Letters, 2015, 13(Suppl.): S21901
- Chinese Optics Letters
- Vol. 13, Issue Suppl., S21901 (2015)
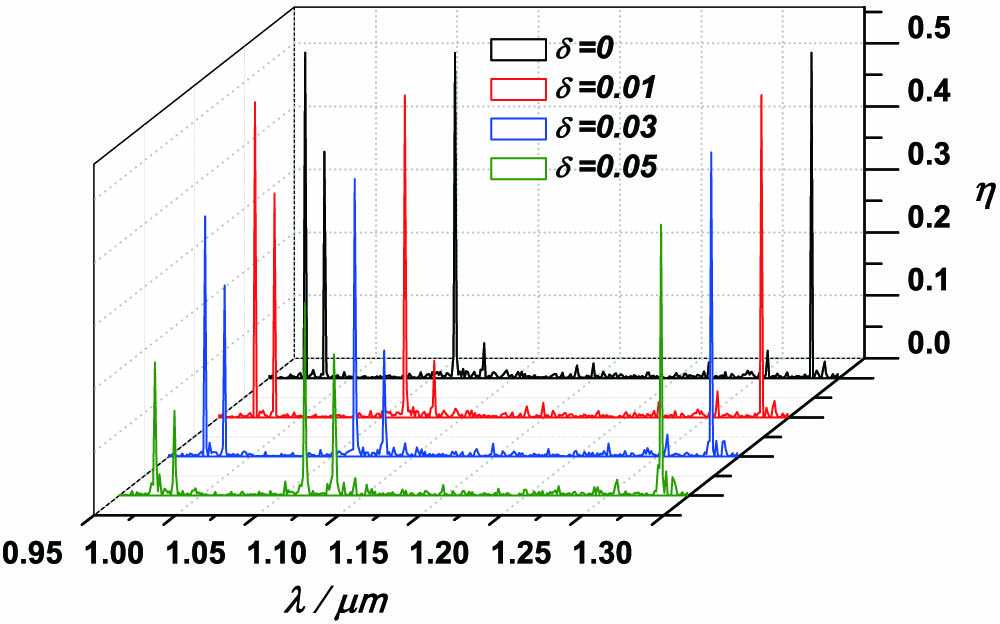
Fig. 1. Variation of SHG conversion efficiency η δ δ = 0
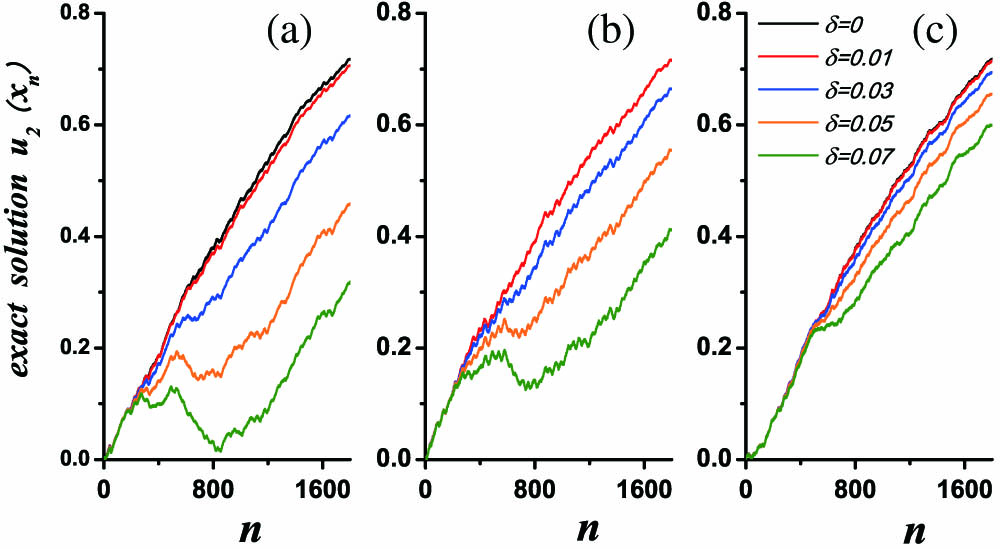
Fig. 2. Term u 2 ( x n ) n δ δ = 0
Fig. 3. Variation of σ u 2 ( x n ) λ = 0.972 μm 5 ); red, blue, green, and orange curves, data for δ = 0.01
Fig. 4. Relative tolerance σ u 2 ( x n ) λ = 1.283 μm λ = 1.064 μm λ = 0.972 μm 5 ).

Set citation alerts for the article
Please enter your email address
© Copyright 2018-2021 | Chinese Laser Press. All Rights Reserved 沪ICP备15018463号-20