• Acta Optica Sinica
  • Vol. 38, Issue 5, 0514004 (2018)
Xianghe Guan1、2, Yanli Zhang1, Junyong Zhang1, and Jianqiang Zhu1、*
Author Affiliations
  • 1 Key Laboratory of High Power Laser and Physics, Shanghai Institute of Optics and Fine Mechanics, Chinese Academy of Sciences, Shanghai 201800, China
  • 2 University of Chinese Academy of Sciences, Beijing 100049, China
  • show less
    DOI: 10.3788/AOS201838.0514004 Cite this Article Set citation alerts
    Xianghe Guan, Yanli Zhang, Junyong Zhang, Jianqiang Zhu. Three-Dimensional Inversion Method for High Power Laser Multi-Pass Amplifier[J]. Acta Optica Sinica, 2018, 38(5): 0514004 Copy Citation Text show less
    Spatial and temporal distributions of normalized intensity of input pulse (method one). (a) Time waveforms at different coordinate points; (b) one-dimensional spatial distribution at different time
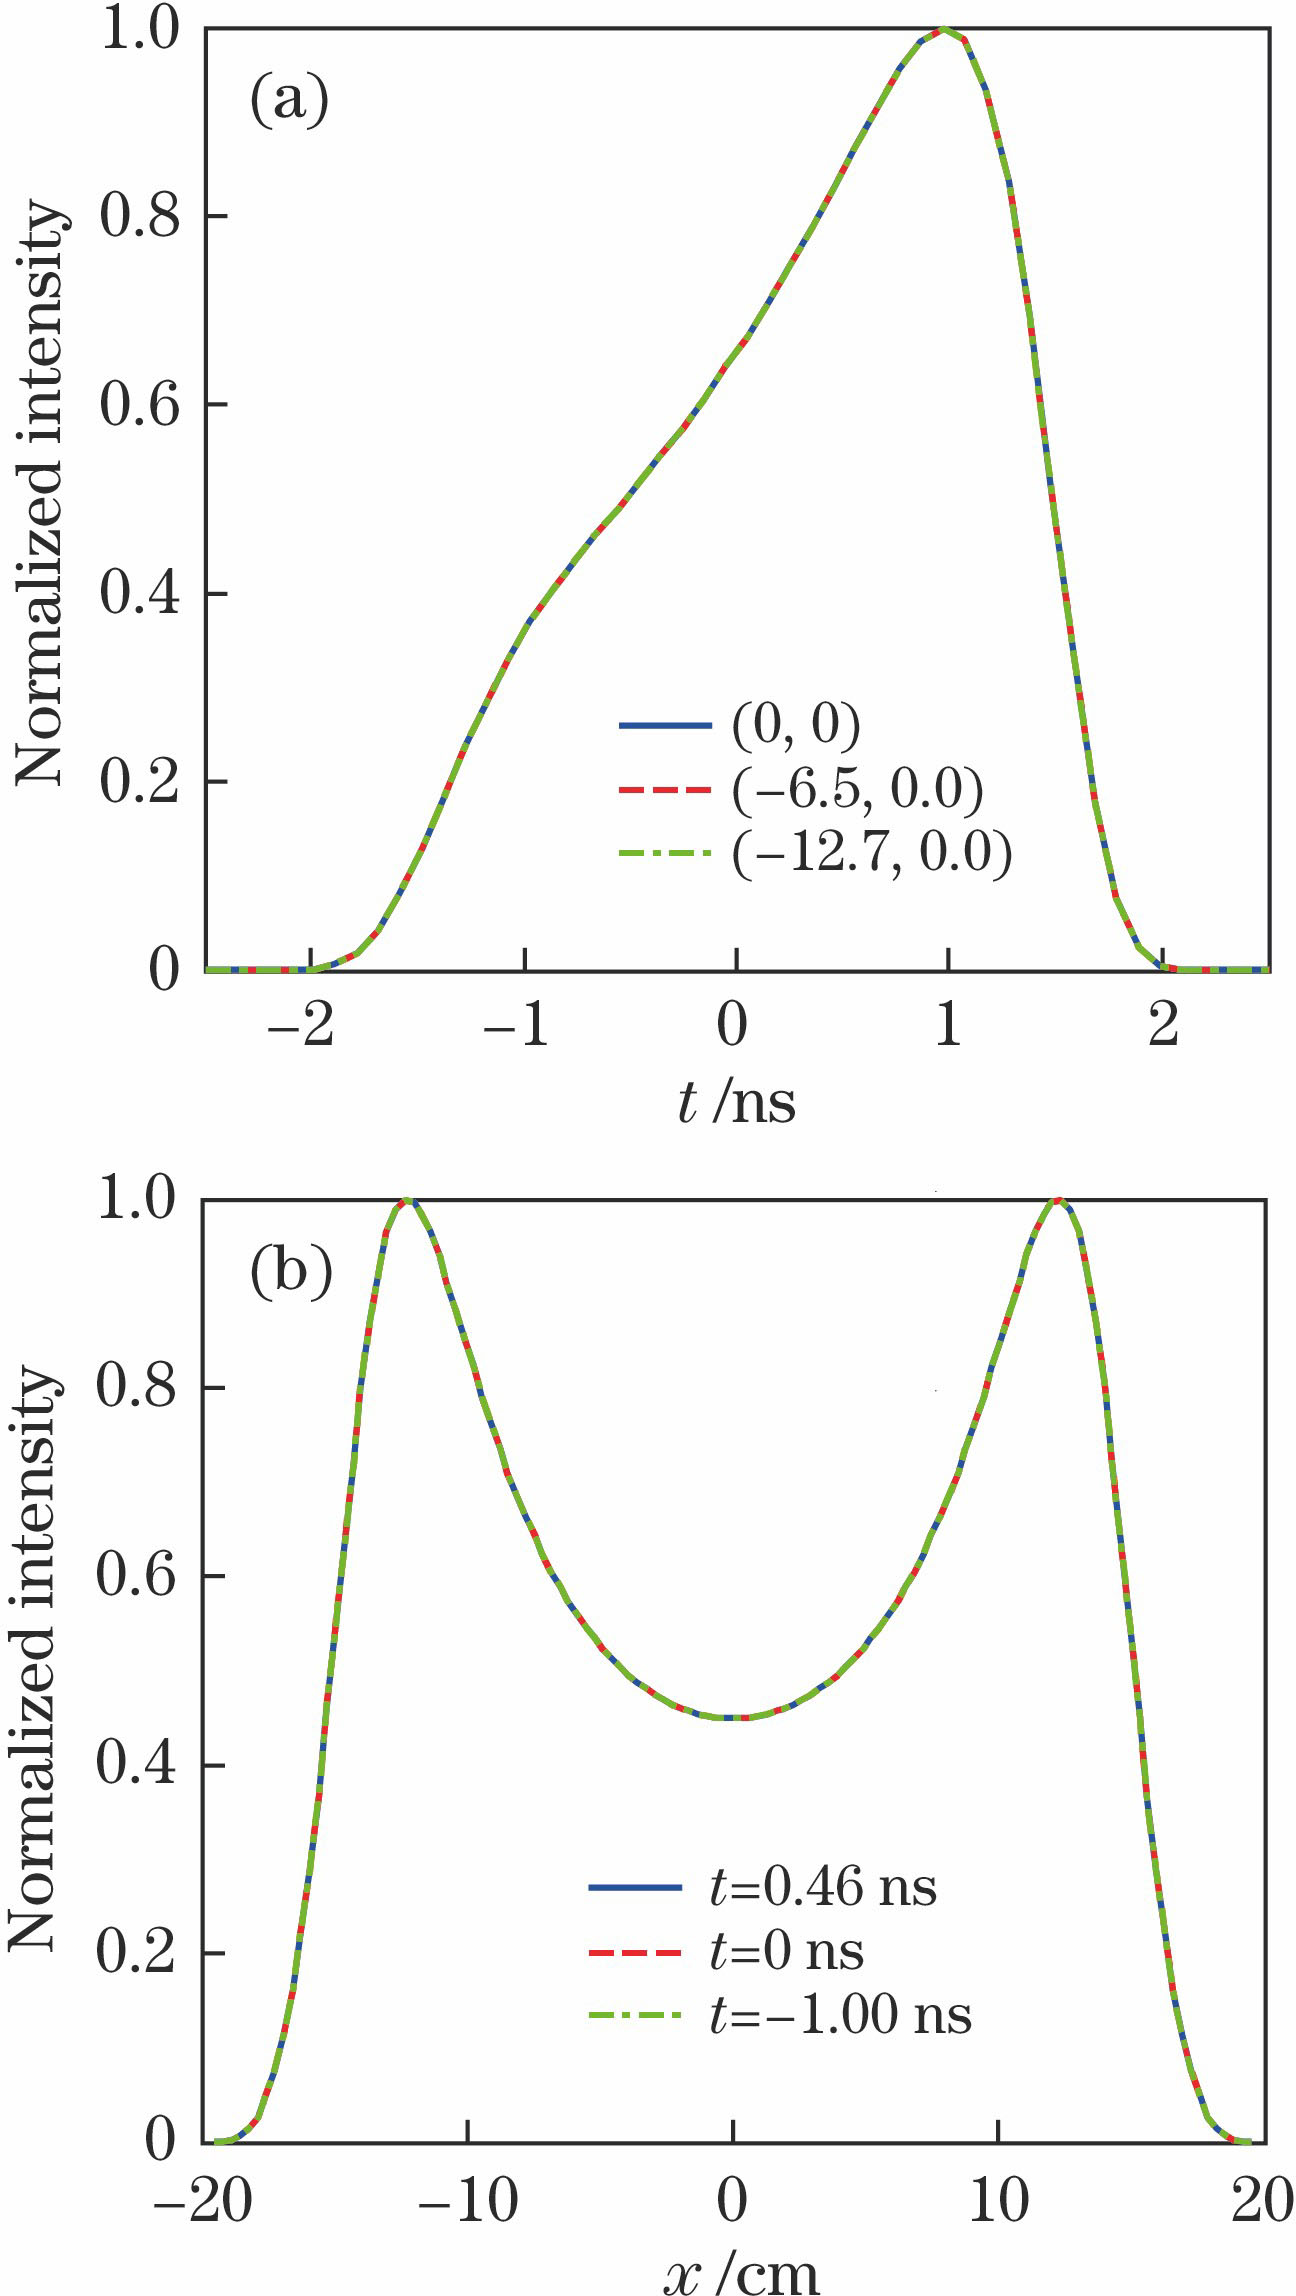
    Fig. 1. Spatial and temporal distributions of normalized intensity of input pulse (method one). (a) Time waveforms at different coordinate points; (b) one-dimensional spatial distribution at different time
    Three-dimensional intensity distribution of input pulse (method one)
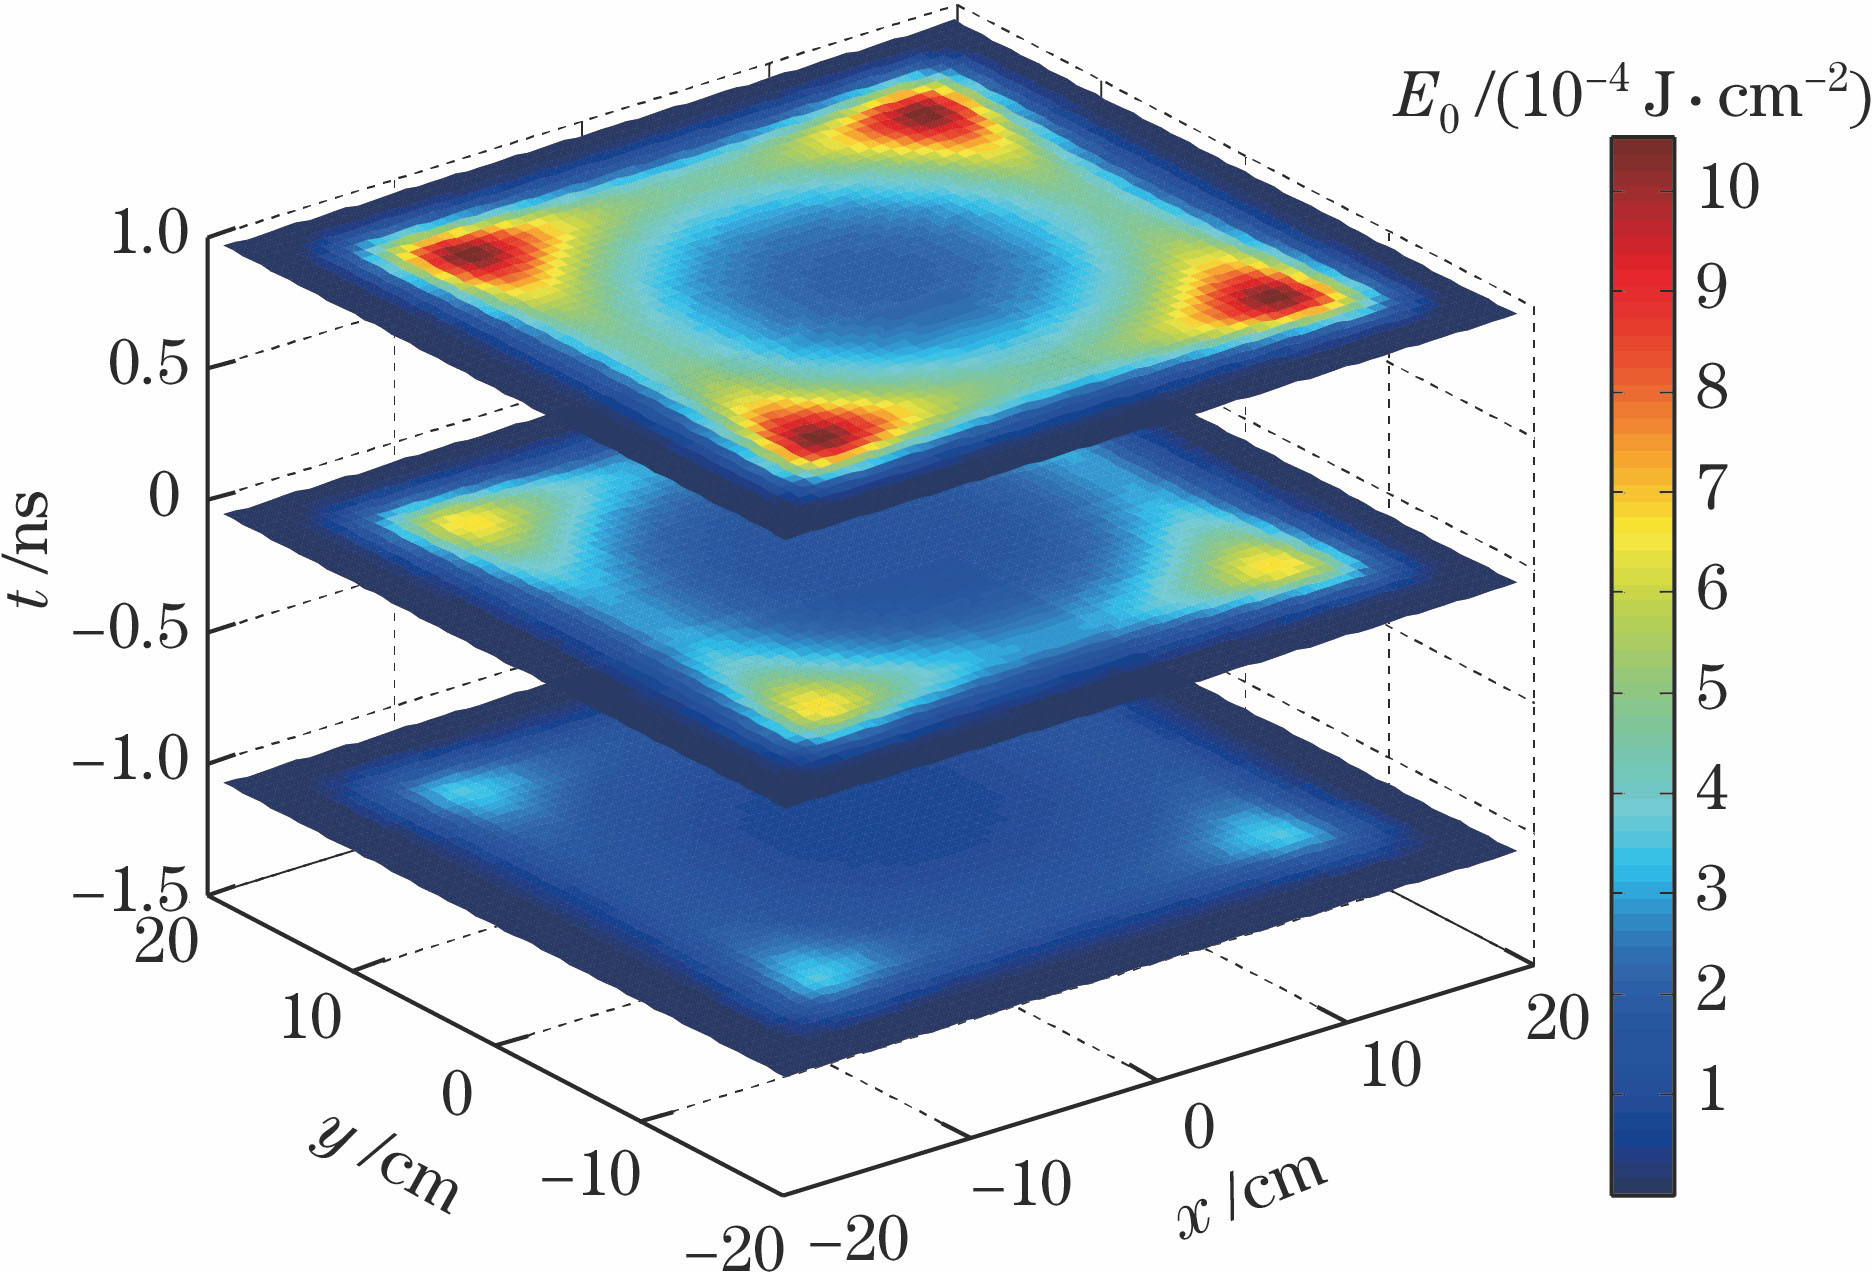
    Fig. 2. Three-dimensional intensity distribution of input pulse (method one)
    Spatial and temporal distributions of normalized intensity of output pulse (method one). (a) Time waveforms at different coordinate points; (b) one-dimensional spatial distribution at different time
    Fig. 3. Spatial and temporal distributions of normalized intensity of output pulse (method one). (a) Time waveforms at different coordinate points; (b) one-dimensional spatial distribution at different time
    Distributions of (a) normalized power waveforms and (b) normalized one-dimensional flux density of output pulse (method one)
    Fig. 4. Distributions of (a) normalized power waveforms and (b) normalized one-dimensional flux density of output pulse (method one)
    Relative deviation of output pulse (method one)
    Fig. 5. Relative deviation of output pulse (method one)
    Spatial and temporal distributions of normalized intensity of input pulse (method two). (a) Time waveforms at different coordinate points; (b) one-dimensional spatial distribution at different time
    Fig. 6. Spatial and temporal distributions of normalized intensity of input pulse (method two). (a) Time waveforms at different coordinate points; (b) one-dimensional spatial distribution at different time
    Three-dimensional intensity distribution of input pulse (method two)
    Fig. 7. Three-dimensional intensity distribution of input pulse (method two)
    Spatial and temporal distributions of normalized intensity of output pulse (method two). (a) Time waveforms at different coordinate points; (b) one-dimensional spatial distribution at different time
    Fig. 8. Spatial and temporal distributions of normalized intensity of output pulse (method two). (a) Time waveforms at different coordinate points; (b) one-dimensional spatial distribution at different time
    Distributions of (a) normalized power waveforms and (b) normalized one-dimensional flux density of output pulse (method two)
    Fig. 9. Distributions of (a) normalized power waveforms and (b) normalized one-dimensional flux density of output pulse (method two)
    Relative deviation of output pulse (method two)
    Fig. 10. Relative deviation of output pulse (method two)
    Xianghe Guan, Yanli Zhang, Junyong Zhang, Jianqiang Zhu. Three-Dimensional Inversion Method for High Power Laser Multi-Pass Amplifier[J]. Acta Optica Sinica, 2018, 38(5): 0514004
    Download Citation