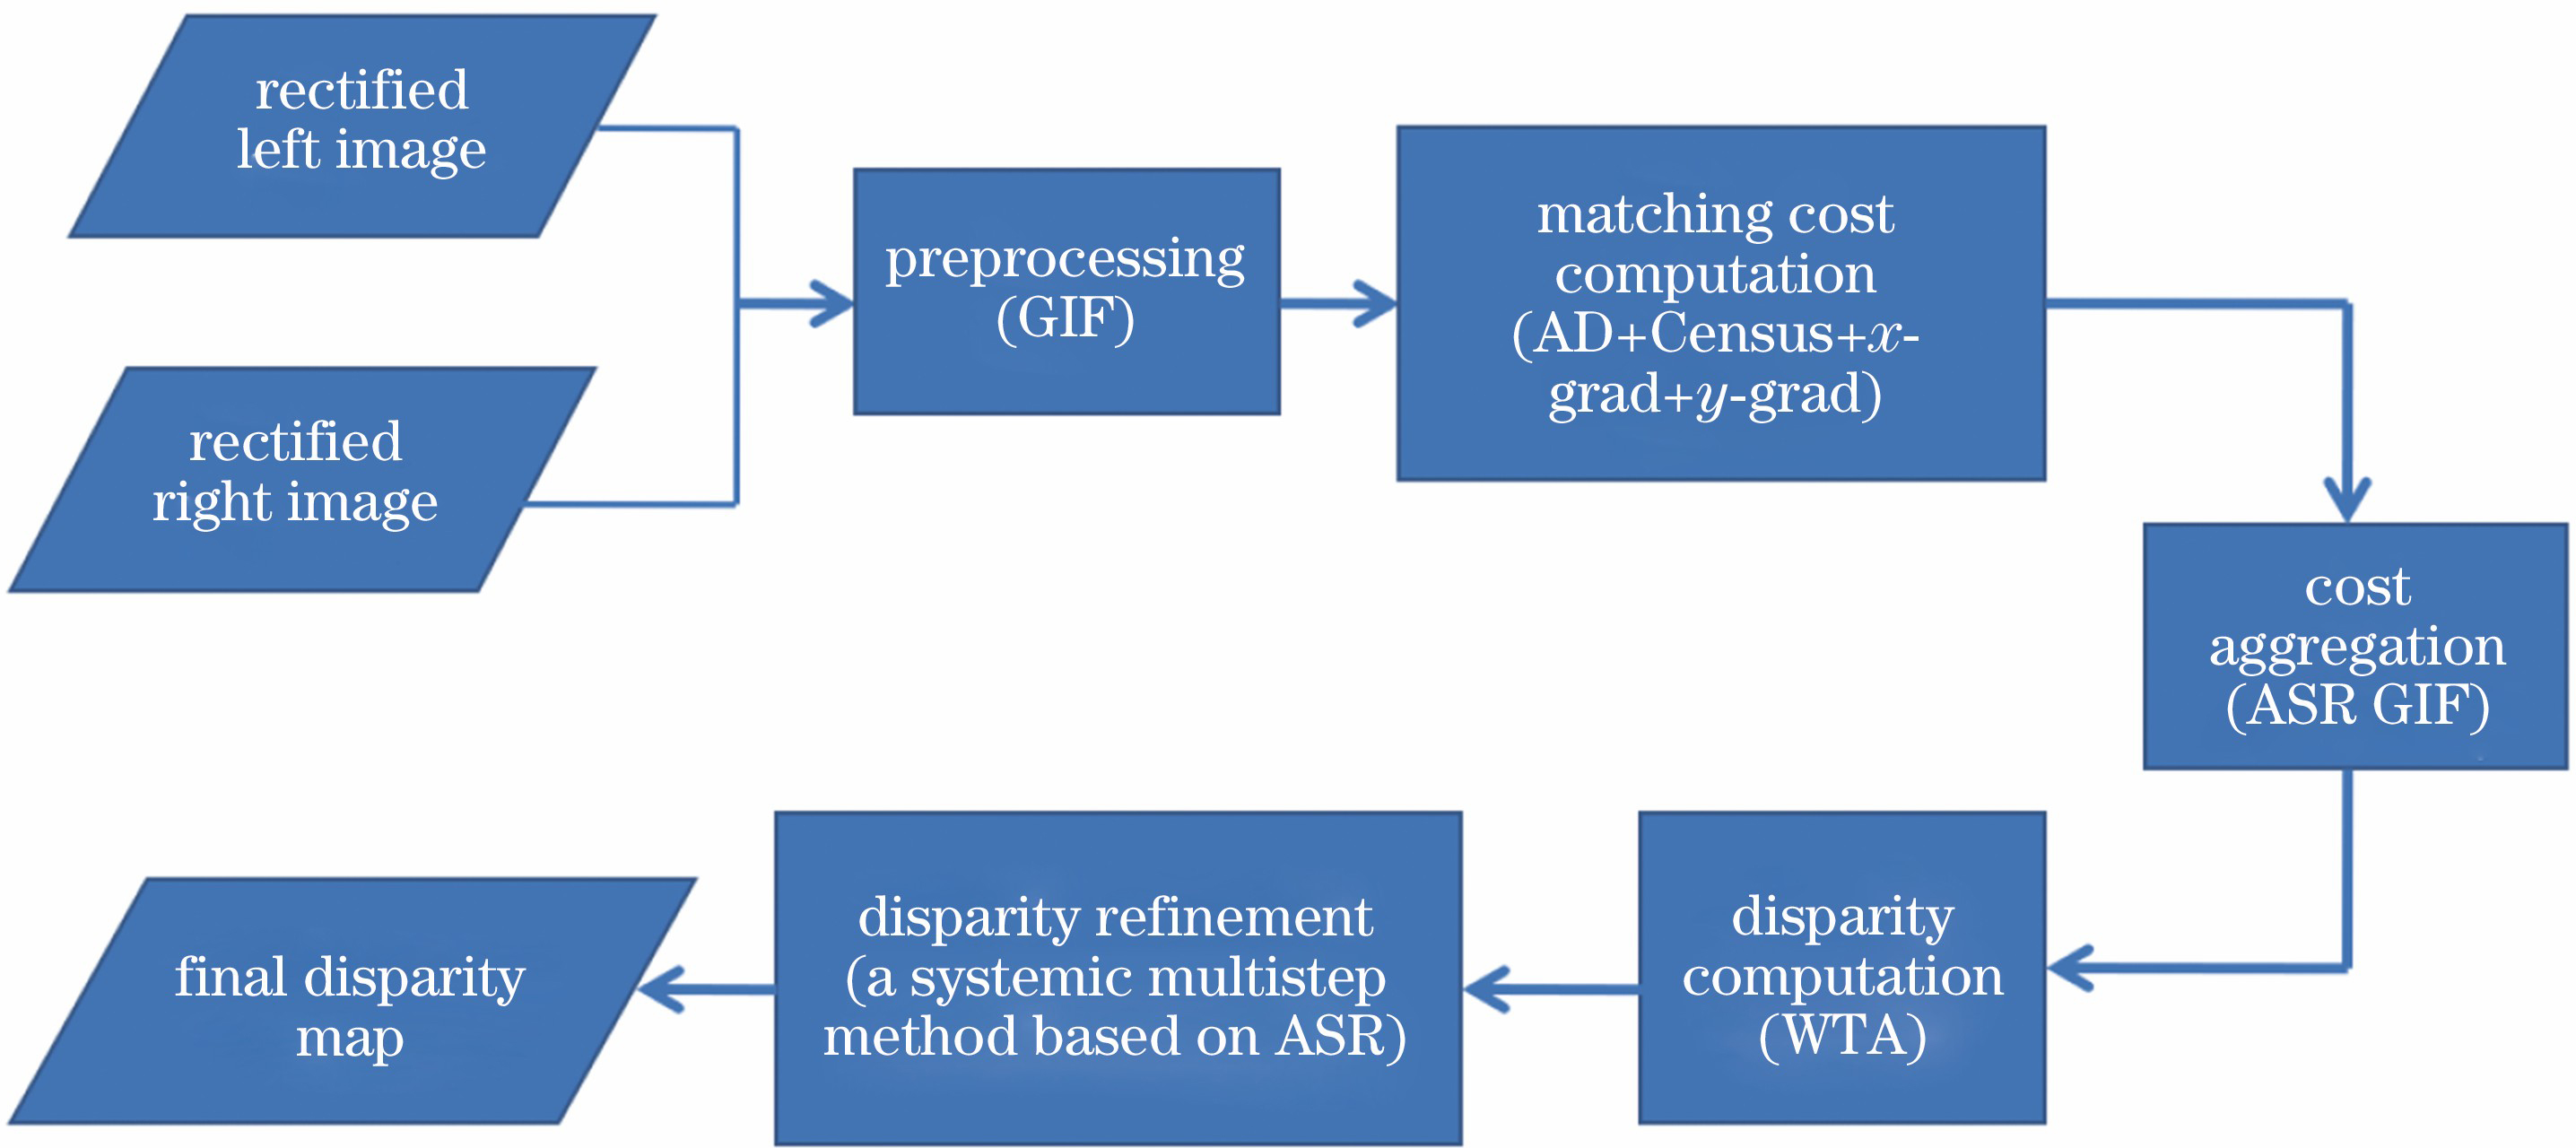
Fig. 1. Flowchart of proposed algorithm
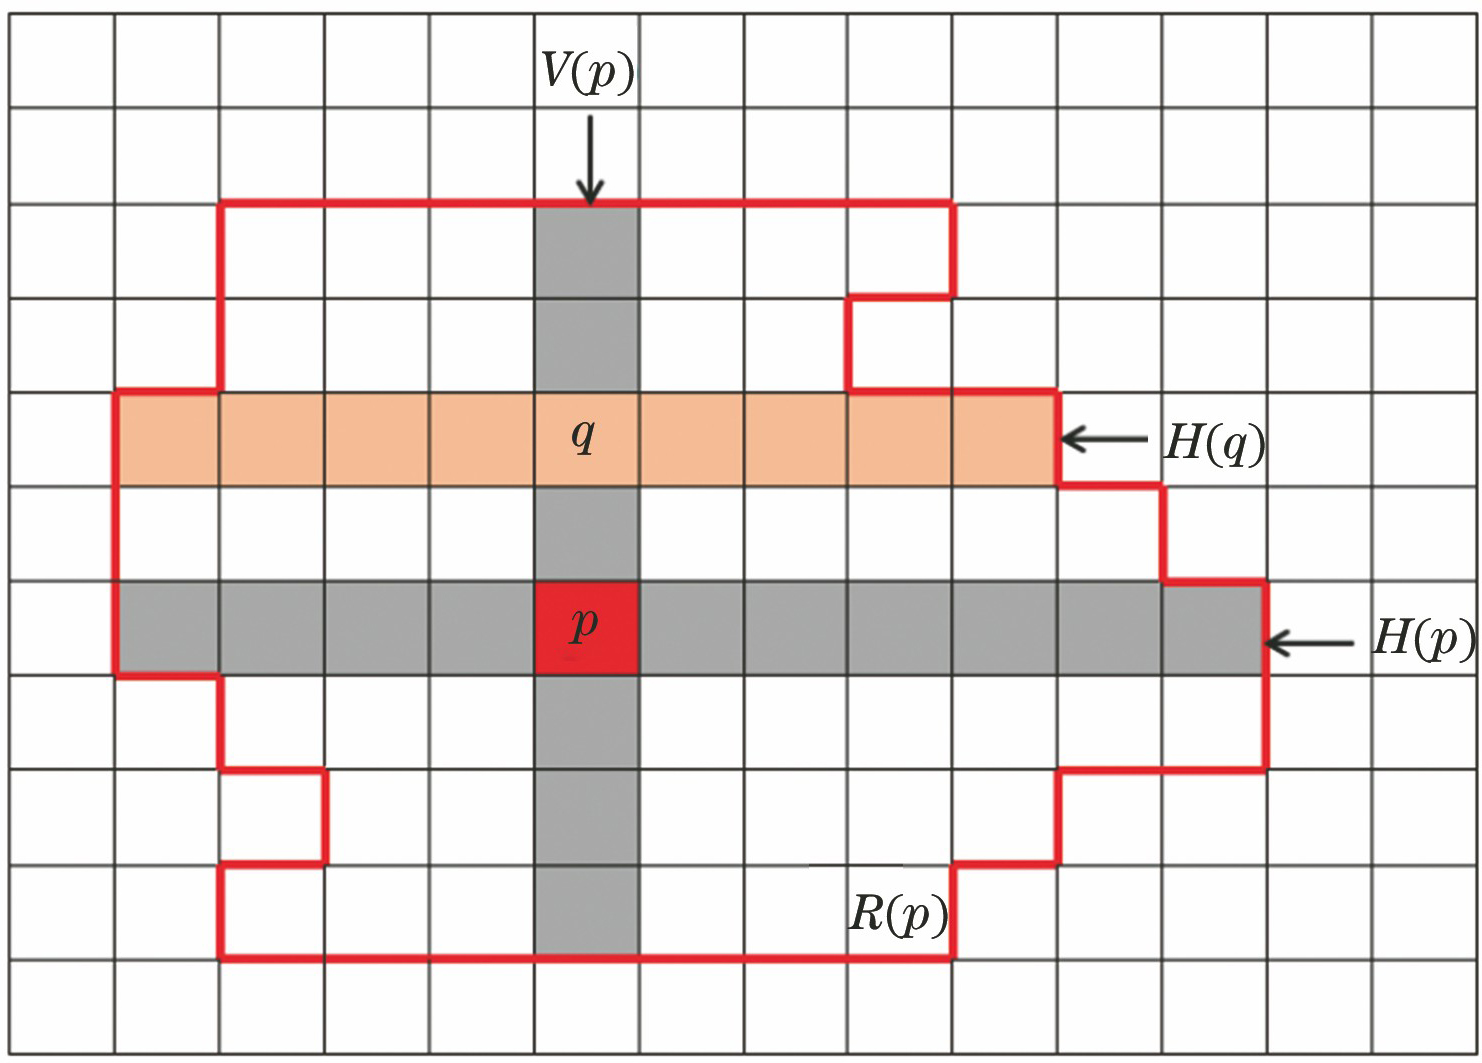
Fig. 2. Schematic of constructing adaptive support region based on cross method
Fig. 3. Disparity maps of three cost computation methods. (a) C1; (b) C2; (c) proposed gradient calculation method
Fig. 4. Weighted averages for all regions and non-occluded regions. (a) Avgerr; (b) RMSE
Fig. 5. Weighted average after disparity refinement on each step. (a)(b) Avgerr; (c)(d) RMSE
Fig. 6. Comparison of disparity results. (a) Adirondack; (b) Jadeplant; (c) Piano; (d) Motorcycle; (e) Recycle
| Parameter | Weighted average /pixel | Reducedpercentage /% |
|---|
| Before disparity refinement | After disparity refinement |
|---|
| Avgerr(all) | 21.1 | 11.30 | 46.4 | | Avgerr(nonocc) | 12.1 | 7.81 | 35.5 | | RMSE(all) | 47.2 | 27.70 | 41.3 | | RMSE(nonocc) | 31.6 | 20.90 | 33.9 |
|
Table 1. Weighted average of errors before and after disparity refinement and reduced percentage (disparity map of proposed gradient calculation method)
| Parameter | Weighted average /pixel | Reduced percentage /% |
|---|
| Before disparity refinement | After disparity refinement |
|---|
| Avgerr(all) | 22.8 | 12.40 | 45.6 | | Avgerr(nonocc) | 13.6 | 8.63 | 36.5 | | RMSE(all) | 49.6 | 29.80 | 39.9 | | RMSE(nonocc) | 34.5 | 22.90 | 33.6 |
|
Table 2. Weighted average of errors before and after disparity refinement and reduced percentage (disparity map of C1)
| Parameter | Weighted average /pixel | Reduced percentage /% |
|---|
| Before disparity refinement | After disparity refinement |
|---|
| Avgerr(all) | 24.5 | 14.9 | 39.2 | | Avgerr(nonocc) | 15.1 | 10.7 | 29.1 | | RMSE(all) | 51.5 | 34.6 | 32.8 | | RMSE(nonocc) | 36.3 | 27.1 | 25.3 |
|
Table 3. Weighted average of errors before and after disparity refinement and reduced percentage (disparity map of C2)
| Image name | LE-ELAS | IEBIMst | SPS | SM-AWP | DSGCA | DoGGuided | Proposed algorithm |
|---|
| Adirondack | 9.31 | 27.30 | 6.51 | 10.50 | 7.68 | 20.10 | 6.40 | | ArtL | 5.90 | 15.10 | 15.20 | 19.90 | 21.70 | 28.00 | 9.00 | | Jadeplant | 64.50 | 55.60 | 40.00 | 62.70 | 45.00 | 56.50 | 26.10 | | Motorcycle | 7.24 | 5.54 | 8.35 | 11.00 | 10.60 | 13.80 | 8.11 | | MotorcycleE | 7.65 | 8.21 | 8.45 | 12.50 | 10.40 | 16.80 | 11.40 | | Piano | 6.25 | 6.40 | 12.00 | 9.08 | 11.50 | 13.40 | 6.15 | | PianoL | 9.69 | 18.90 | 25.00 | 29.70 | 24.50 | 37.30 | 34.00 | | Pipes | 12.80 | 11.80 | 16.10 | 21.10 | 19.90 | 23.80 | 14.90 | | Playroom | 10.10 | 18.00 | 25.20 | 20.70 | 24.60 | 30.30 | 10.50 | | Playtable | 23.90 | 17.90 | 15.70 | 9.50 | 34.50 | 30.80 | 16.70 | | PlaytableP | 4.27 | 4.95 | 12.40 | 9.75 | 14.80 | 13.00 | 10.00 | | Recycle | 7.39 | 5.29 | 8.81 | 7.18 | 7.56 | 9.13 | 4.20 | | Shelves | 8.48 | 17.10 | 23.70 | 11.40 | 17.30 | 19.00 | 9.97 | | Teddy | 2.98 | 5.31 | 8.01 | 9.44 | 12.20 | 13.40 | 3.35 | | Vintage | 14.00 | 10.90 | 53.70 | 16.80 | 43.80 | 13.60 | 10.90 | | Australia | 15.20 | 9.17 | 8.64 | 19.10 | 16.60 | 18.20 | 12.00 | | AustraliaP | 6.94 | 5.54 | 8.77 | 18.20 | 12.40 | 12.60 | 8.31 | | Bicycle2 | 6.68 | 7.54 | 11.40 | 16.00 | 12.90 | 17.60 | 13.70 | | Classroom2 | 24.60 | 27.90 | 20.20 | 29.30 | 32.60 | 34.90 | 9.09 | | Classroom2E | 69.60 | 55.00 | 27.00 | 51.10 | 39.30 | 76.30 | 67.10 | | Computer | 12.40 | 13.80 | 22.20 | 22.50 | 20.60 | 22.10 | 13.20 | | Crusade | 21.70 | 74.30 | 50.80 | 91.80 | 49.50 | 73.40 | 36.30 | | CrusadeP | 21.00 | 74.60 | 50.20 | 94.90 | 50.50 | 71.30 | 35.60 | | Djembe | 2.73 | 2.10 | 3.65 | 7.33 | 5.71 | 6.64 | 2.98 | | DjembeL | 13.80 | 29.10 | 17.20 | 31.80 | 24.50 | 39.00 | 19.50 | | Hoops | 22.80 | 45.00 | 38.70 | 37.70 | 36.30 | 56.60 | 23.00 | | Livingroom | 10.30 | 9.49 | 30.40 | 16.80 | 22.90 | 25.90 | 7.18 | | Newkuba | 16.20 | 13.30 | 20.30 | 28.50 | 23.20 | 28.70 | 11.30 | | Plants | 43.30 | 23.30 | 26.20 | 32.20 | 27.70 | 33.90 | 25.80 | | Staircase | 21.30 | 30.90 | 39.40 | 36.40 | 39.80 | 57.50 | 29.80 | | Weighted average | 15.95 | 20.95 | 20.70 | 26.50 | 22.80 | 29.20 | 15.20 |
|
Table 4. Comparison of Avgerr in all regionspixel
| Image name | LE-ELAS | IEBIMst | SPS | SM-AWP | DSGCA | DoGGuided | Proposed algorithm |
|---|
| Adirondack | 8.46 | 26.10 | 3.57 | 6.31 | 3.25 | 15.20 | 4.84 | | ArtL | 3.83 | 4.67 | 5.34 | 9.65 | 5.95 | 9.57 | 4.62 | | Jadeplant | 41.10 | 41.90 | 22.80 | 31.80 | 18.90 | 27.10 | 16.10 | | Motorcycle | 5.12 | 2.72 | 3.11 | 4.71 | 3.60 | 5.64 | 4.58 | | MotorcycleE | 5.80 | 4.99 | 3.15 | 6.39 | 3.41 | 8.31 | 7.72 | | Piano | 5.54 | 5.69 | 9.34 | 6.68 | 7.17 | 8.09 | 5.20 | | PianoL | 8.97 | 17.50 | 22.90 | 28.40 | 21.10 | 32.40 | 34.40 | | Pipes | 7.44 | 5.47 | 6.78 | 10.60 | 7.23 | 9.67 | 7.53 | | Playroom | 8.76 | 12.90 | 12.50 | 9.08 | 9.36 | 14.00 | 5.05 | | Playtable | 22.40 | 14.80 | 9.70 | 5.09 | 29.40 | 24.50 | 13.00 | | PlaytableP | 3.47 | 3.26 | 7.64 | 5.18 | 7.94 | 5.32 | 5.67 | | Recycle | 6.93 | 4.99 | 6.27 | 3.86 | 3.80 | 5.56 | 3.37 | | Shelves | 8.26 | 16.40 | 22.30 | 9.73 | 14.70 | 16.20 | 9.49 | | Teddy | 2.29 | 2.64 | 1.52 | 3.64 | 3.51 | 4.15 | 2.15 | | Vintage | 13.10 | 10.40 | 52.60 | 10.70 | 39.70 | 15.00 | 9.64 | | Australia | 13.40 | 6.53 | 5.32 | 13.50 | 11.00 | 12.30 | 8.48 | | AustraliaP | 5.27 | 3.36 | 5.48 | 12.70 | 6.75 | 6.62 | 5.70 | | Bicycle2 | 4.88 | 5.04 | 7.70 | 11.00 | 7.01 | 11.20 | 10.50 | | Classroom2 | 19.30 | 19.30 | 5.60 | 17.50 | 13.70 | 16.30 | 5.35 | | Classroom2E | 66.50 | 45.70 | 12.50 | 41.80 | 21.50 | 62.60 | 64.80 | | Computer | 6.06 | 3.41 | 8.05 | 11.00 | 5.90 | 6.83 | 3.92 | | Crusade | 15.60 | 51.30 | 15.10 | 70.10 | 6.72 | 34.00 | 19.20 | | CrusadeP | 13.70 | 46.40 | 13.10 | 72.30 | 5.85 | 30.60 | 15.30 | | Djembe | 1.94 | 1.52 | 1.84 | 4.01 | 2.78 | 3.65 | 2.23 | | DjembeL | 13.30 | 29.20 | 16.10 | 28.30 | 22.20 | 37.00 | 19.20 | | Hoops | 18.20 | 39.20 | 22.80 | 25.80 | 17.20 | 35.00 | 16.90 | | Livingroom | 9.62 | 8.77 | 19.40 | 7.88 | 11.90 | 13.40 | 6.19 | | Newkuba | 12.80 | 8.19 | 12.60 | 21.50 | 11.10 | 14.20 | 7.60 | | Plants | 35.40 | 16.90 | 14.50 | 19.70 | 14.10 | 19.10 | 17.90 | | Staircase | 19.10 | 27.60 | 27.50 | 21.70 | 23.80 | 34.40 | 24.40 | | Weighted average | 12.43 | 15.10 | 11.00 | 17.36 | 10.23 | 15.85 | 10.36 |
|
Table 5. Comparison of Avgerr in non-occluded regionspixel
| Image name | LE-ELAS | IEBIMst | SPS | SM-AWP | DSGCA | DoGGuided | Proposed algorithm |
|---|
| Adirondack | 25.40 | 58.90 | 23.00 | 30.30 | 25.10 | 48.90 | 19.20 | | ArtL | 16.80 | 38.80 | 39.90 | 38.70 | 48.60 | 59.50 | 22.80 | | Jadeplant | 120.00 | 128.00 | 95.80 | 119.00 | 102.00 | 118.00 | 62.60 | | Motorcycle | 23.30 | 20.10 | 29.10 | 33.80 | 32.50 | 39.40 | 23.20 | | MotorcycleE | 24.00 | 27.40 | 29.80 | 36.90 | 32.40 | 44.60 | 28.90 | | Piano | 13.90 | 13.90 | 32.10 | 19.30 | 29.20 | 31.60 | 12.40 | | PianoL | 18.70 | 39.00 | 53.80 | 56.30 | 50.80 | 65.80 | 65.30 | | Pipes | 30.70 | 30.20 | 41.00 | 47.30 | 47.40 | 52.60 | 35.10 | | Playroom | 25.90 | 38.00 | 59.50 | 47.80 | 58.30 | 66.70 | 27.60 | | Playtable | 52.30 | 38.60 | 43.30 | 25.00 | 68.30 | 59.50 | 40.10 | | PlaytableP | 12.60 | 14.20 | 37.20 | 25.50 | 38.40 | 34.40 | 28.00 | | Recycle | 17.60 | 17.50 | 26.50 | 22.50 | 23.30 | 25.70 | 10.60 | | Shelves | 15.30 | 30.40 | 44.40 | 23.80 | 33.50 | 33.90 | 19.40 | | Teddy | 8.32 | 18.60 | 27.80 | 25.90 | 34.90 | 36.70 | 13.60 | | Vintage | 27.40 | 28.80 | 131.00 | 45.80 | 105.00 | 66.10 | 27.70 | | Australia | 34.90 | 27.90 | 30.00 | 46.60 | 40.80 | 45.20 | 32.60 | | AustraliaP | 26.60 | 22.90 | 30.90 | 45.80 | 35.90 | 38.30 | 27.50 | | Bicycle2 | 21.00 | 23.50 | 32.10 | 37.70 | 32.60 | 40.20 | 32.30 | | Classroom2 | 55.80 | 68.70 | 60.90 | 64.10 | 82.60 | 85.40 | 27.30 | | Classroom2E | 112.00 | 106.00 | 76.40 | 93.10 | 88.30 | 148.00 | 127.00 | | Computer | 28.20 | 34.10 | 53.70 | 42.30 | 46.70 | 48.00 | 31.70 | | Crusade | 58.70 | 156.00 | 141.00 | 152.00 | 131.00 | 151.00 | 79.40 | | CrusadeP | 59.00 | 160.00 | 140.00 | 156.00 | 134.00 | 150.00 | 80.10 | | Djembe | 8.10 | 7.30 | 15.00 | 27.80 | 19.70 | 21.50 | 9.28 | | DjembeL | 31.00 | 58.60 | 42.80 | 61.30 | 51.40 | 66.40 | 42.70 | | Hoops | 51.70 | 77.90 | 78.20 | 72.60 | 73.70 | 99.90 | 50.10 | | Livingroom | 23.00 | 24.90 | 67.90 | 39.80 | 52.80 | 58.60 | 17.60 | | Newkuba | 53.30 | 38.10 | 65.20 | 78.20 | 68.00 | 81.90 | 33.70 | | Plants | 72.60 | 54.60 | 59.30 | 63.90 | 62.90 | 69.40 | 55.70 | | Staircase | 46.00 | 48.20 | 85.80 | 73.60 | 78.70 | 102.00 | 51.20 | | Weighted average | 36.25 | 48.15 | 54.85 | 55.20 | 56.15 | 64.50 | 35.70 |
|
Table 6. Comparison of RMSE in all regionspixel
| Image name | LE-ELAS | IEBIMst | SPS | SM-AWP | DSGCA | DoGGuided | Proposed algorithm |
|---|
| Adirondack | 24.60 | 58.00 | 16.40 | 21.30 | 13.20 | 42.20 | 15.80 | | ArtL | 13.80 | 15.60 | 17.20 | 22.70 | 17.90 | 28.30 | 14.10 | | Jadeplant | 91.90 | 121.00 | 75.70 | 81.50 | 63.60 | 75.70 | 46.80 | | Motorcycle | 18.30 | 11.40 | 15.50 | 19.10 | 14.90 | 21.40 | 14.80 | | MotorcycleE | 20.00 | 20.90 | 15.50 | 24.00 | 14.50 | 28.80 | 22.30 | | Piano | 13.10 | 12.70 | 27.50 | 14.50 | 20.20 | 19.40 | 10.50 | | PianoL | 17.90 | 37.40 | 52.00 | 56.20 | 47.30 | 60.90 | 66.80 | | Pipes | 23.30 | 19.20 | 24.50 | 32.20 | 24.60 | 29.60 | 24.50 | | Playroom | 25.50 | 31.50 | 35.80 | 27.20 | 25.80 | 37.50 | 13.90 | | Playtable | 51.20 | 32.40 | 33.10 | 14.30 | 63.90 | 52.20 | 33.70 | | PlaytableP | 11.30 | 9.20 | 29.10 | 15.30 | 25.60 | 15.50 | 15.30 | | Recycle | 17.10 | 16.90 | 21.90 | 12.90 | 13.60 | 18.10 | 8.36 | | Shelves | 15.10 | 29.40 | 43.50 | 20.20 | 29.80 | 29.70 | 18.60 | | Teddy | 6.86 | 10.70 | 6.63 | 12.10 | 14.40 | 14.20 | 9.72 | | Vintage | 26.30 | 29.00 | 134.00 | 26.20 | 104.00 | 50.70 | 25.00 | | Australia | 31.50 | 21.30 | 22.40 | 37.80 | 31.00 | 35.40 | 25.20 | | AustraliaP | 22.80 | 16.40 | 23.50 | 36.70 | 24.90 | 25.90 | 22.40 | | Bicycle2 | 17.10 | 17.40 | 26.00 | 29.90 | 22.00 | 30.70 | 27.30 | | Classroom2 | 49.80 | 57.50 | 26.10 | 48.50 | 47.10 | 52.60 | 19.50 | | Classroom2E | 112.00 | 99.20 | 53.30 | 86.30 | 59.10 | 136.00 | 126.00 | | Computer | 16.60 | 9.47 | 30.00 | 22.50 | 17.50 | 20.50 | 11.30 | | Crusade | 49.80 | 131.00 | 76.70 | 127.00 | 32.90 | 84.20 | 51.00 | | CrusadeP | 48.60 | 123.00 | 71.20 | 131.00 | 31.10 | 79.20 | 37.90 | | Djembe | 5.73 | 5.54 | 9.13 | 17.90 | 11.80 | 14.00 | 7.17 | | DjembeL | 30.80 | 59.20 | 41.70 | 55.00 | 49.20 | 65.10 | 43.00 | | Hoops | 47.50 | 72.70 | 59.70 | 60.10 | 46.30 | 73.20 | 43.40 | | Livingroom | 22.70 | 24.30 | 51.80 | 21.30 | 32.60 | 35.30 | 16.00 | | Newkuba | 52.00 | 26.50 | 54.00 | 73.80 | 42.50 | 50.50 | 27.90 | | Plants | 62.40 | 45.00 | 42.40 | 46.60 | 42.90 | 47.90 | 44.20 | | Staircase | 42.00 | 41.80 | 75.40 | 56.20 | 60.60 | 66.20 | 43.50 | | Weighted average | 31.45 | 39.15 | 37.45 | 41.20 | 31.45 | 41.50 | 26.65 |
|
Table 7. Comparison of RMSE in non-occluded regionspixel