
Lingling Guo, Qichang Zhao, Yong Yang, Jun He, Yang Zhang. A Nonlinearity Correction Method for the Response Produced by the Infrared Detectors of the Fourier Transform Spectrometers[J]. Acta Optica Sinica, 2020, 40(5): 0530002
- Acta Optica Sinica
- Vol. 40, Issue 5, 0530002 (2020)
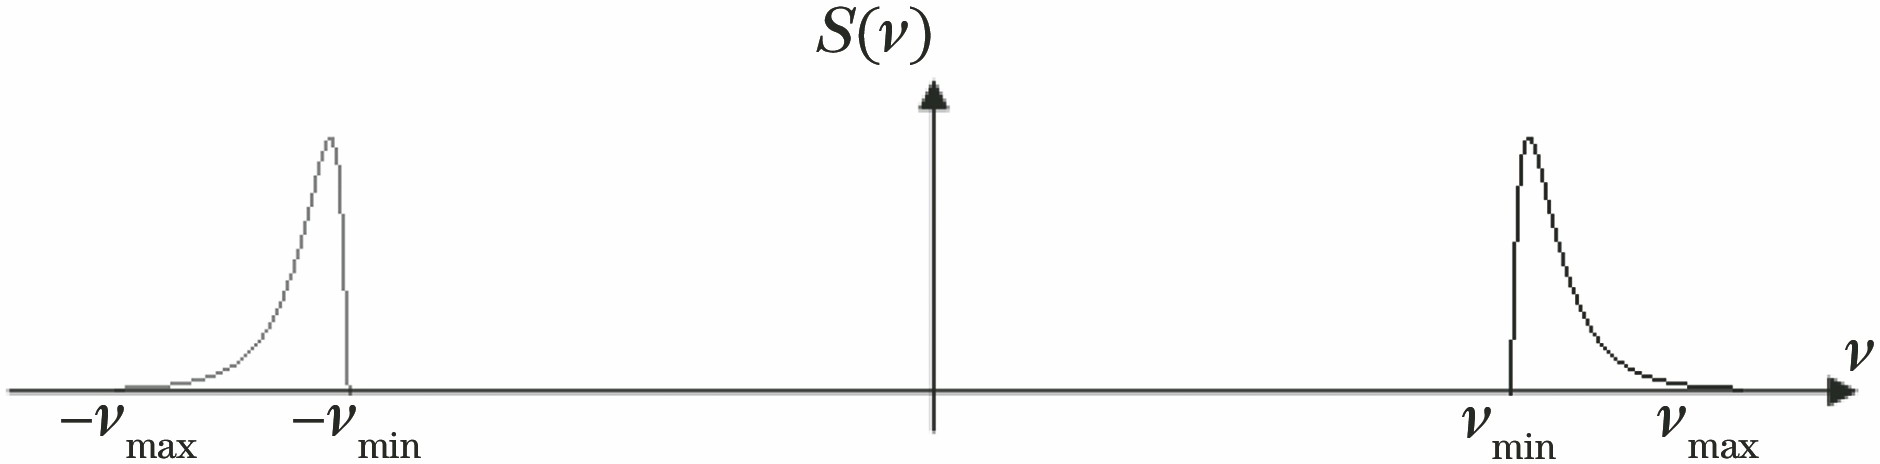
Fig. 1. Diagrammatic sketch of an ideal spectrum
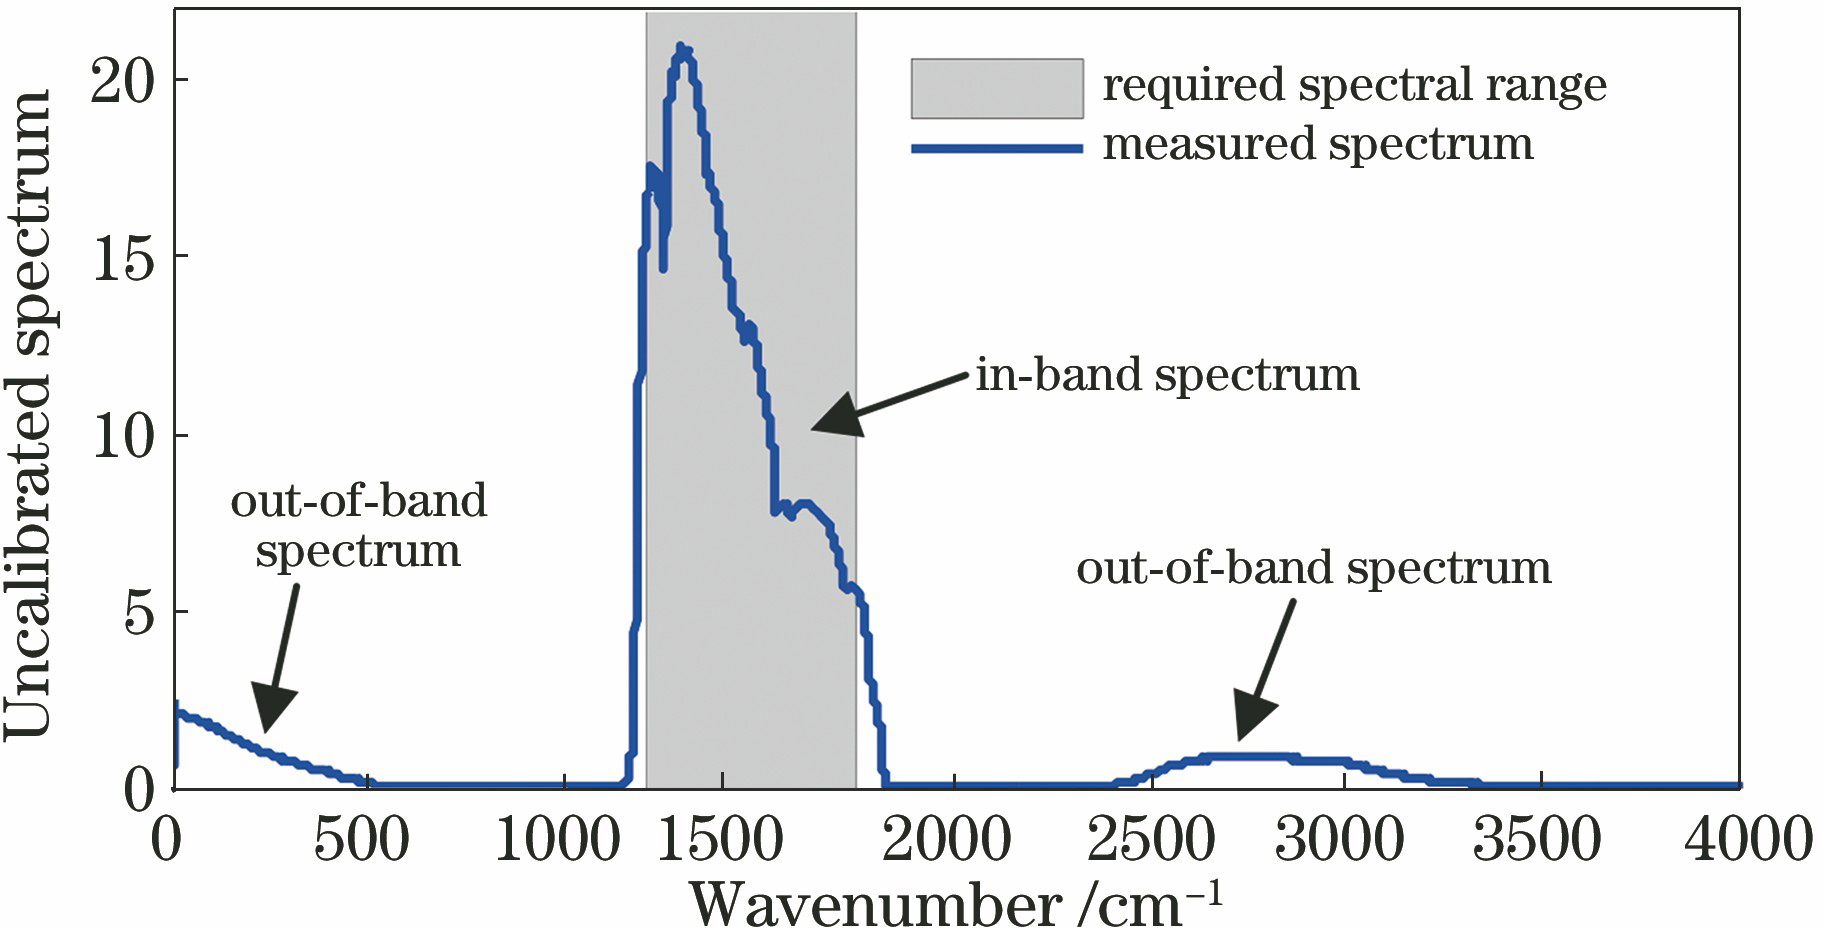
Fig. 2. Raw spectrum of a low-temperature blackbody observed by FTS
Fig. 3. Measured spectra of the external blackbody at different temperatures observed by the FTS
Fig. 4. Response relationship between uncalibrated spectra and blackbody radiances observed by FTS. (a) Lower range; (b) higher range
Fig. 5. Relative coefficients calculation corresponding to measured spectra of the external blackbody observed by FTS at different temperatures. (a) 7 ℃; (b) 17 ℃; (c) 22 ℃; (d) 27 ℃; (e) 32 ℃; (f) 37 ℃; (g) 42℃; (h) 52 ℃
Fig. 6. Response relationship between uncalibrated spectra and blackbody radiances. (a) Before nonlinearity correction; (b) after nonlinearity correction
Fig. 7. Comparison of original and corrected spectra
Fig. 8. Radiance bias of the 47 ℃ blackbody radiance based on linear radiometric calibration after nonlinearity correction. (a) Bias; (b) relative bias
Fig. 9. Radiance bias of the 27 ℃ blackbody based on linear radiometric calibration after nonlinearity correction. (a) Bias; (b) relative bias
Fig. 10. Radiance bias of the -3 ℃ blackbody based on linear radiometric calibration. (a) Bias; (b) relative bias
|
Table 1. Goodness of fit in the relative coefficients calculation
|
Table 2. Goodness of linear fit corresponding to the typical wavenumber channel shown in Fig. 6

Set citation alerts for the article
Please enter your email address
© Copyright 2018-2021 | Chinese Laser Press. All Rights Reserved 沪ICP备15018463号-20