• Chinese Optics Letters
  • Vol. 17, Issue 9, 090604 (2019)
Xin Yang1, Shibiao Wei2, Shanshan Kou3, Fei Yuan1, and En Cheng1、*
Author Affiliations
  • 1Key Laboratory of Underwater Acoustic Communication and Marine Information Technology, Ministry of Education, Xiamen University, Xiamen 361005, China
  • 2Centre for Micro-Photonics, Faculty of Engineering, Science and Technology, Swinburne University of Technology, Hawthorn, VIC 3122, Australia
  • 3Department of Chemistry and Physics, La Trobe Institute for Molecular Science (LIMS), La Trobe University, Melbourne, VIC 3086, Australia
  • show less
    DOI: 10.3788/COL201917.090604 Cite this Article Set citation alerts
    Xin Yang, Shibiao Wei, Shanshan Kou, Fei Yuan, En Cheng. Misalignment measurement of optical vortex beam in free space[J]. Chinese Optics Letters, 2019, 17(9): 090604 Copy Citation Text show less
    Top view along the y axis of the simplified case, where the incident light beam carrying the OAM is in the x-z plane. (a) Schematic illustration of the transversal displacement of a misaligned laser beam, where D is the diameter of the laser beam spot, and Δd is the transversal displacement of a laser beam that has been shifted. (b) Schematic illustration of the tilt of a misaligned laser beam, where θ is the tilt angle, and D/cos⁡θ is the actual light spot diameter that is captured by the CCD when the tilt occurs.
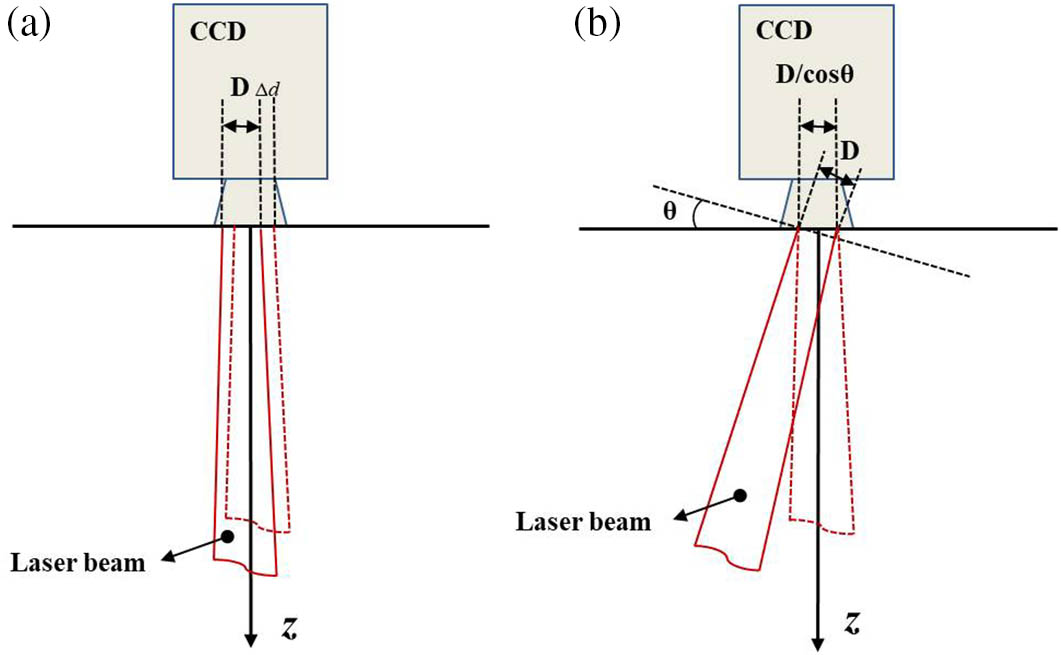
    Fig. 1. Top view along the y axis of the simplified case, where the incident light beam carrying the OAM is in the x-z plane. (a) Schematic illustration of the transversal displacement of a misaligned laser beam, where D is the diameter of the laser beam spot, and Δd is the transversal displacement of a laser beam that has been shifted. (b) Schematic illustration of the tilt of a misaligned laser beam, where θ is the tilt angle, and D/cosθ is the actual light spot diameter that is captured by the CCD when the tilt occurs.
    Flowcharts for measurement of misalignments of the OV beam. (a) Transversal displacements of various OV maps as captured by our experimental setup and measured using the cross-correlation algorithm. A template of an OV beam is obtained by performing a cross-correlation between a reference OV map simulated according to the experimental conditions and an OV map with no transversal displacement. (b) The tilt of the OV map can be determined by simulating a set of OV templates with set tilt angles and then cycling them with OV maps that have a tilt obtained using our method.
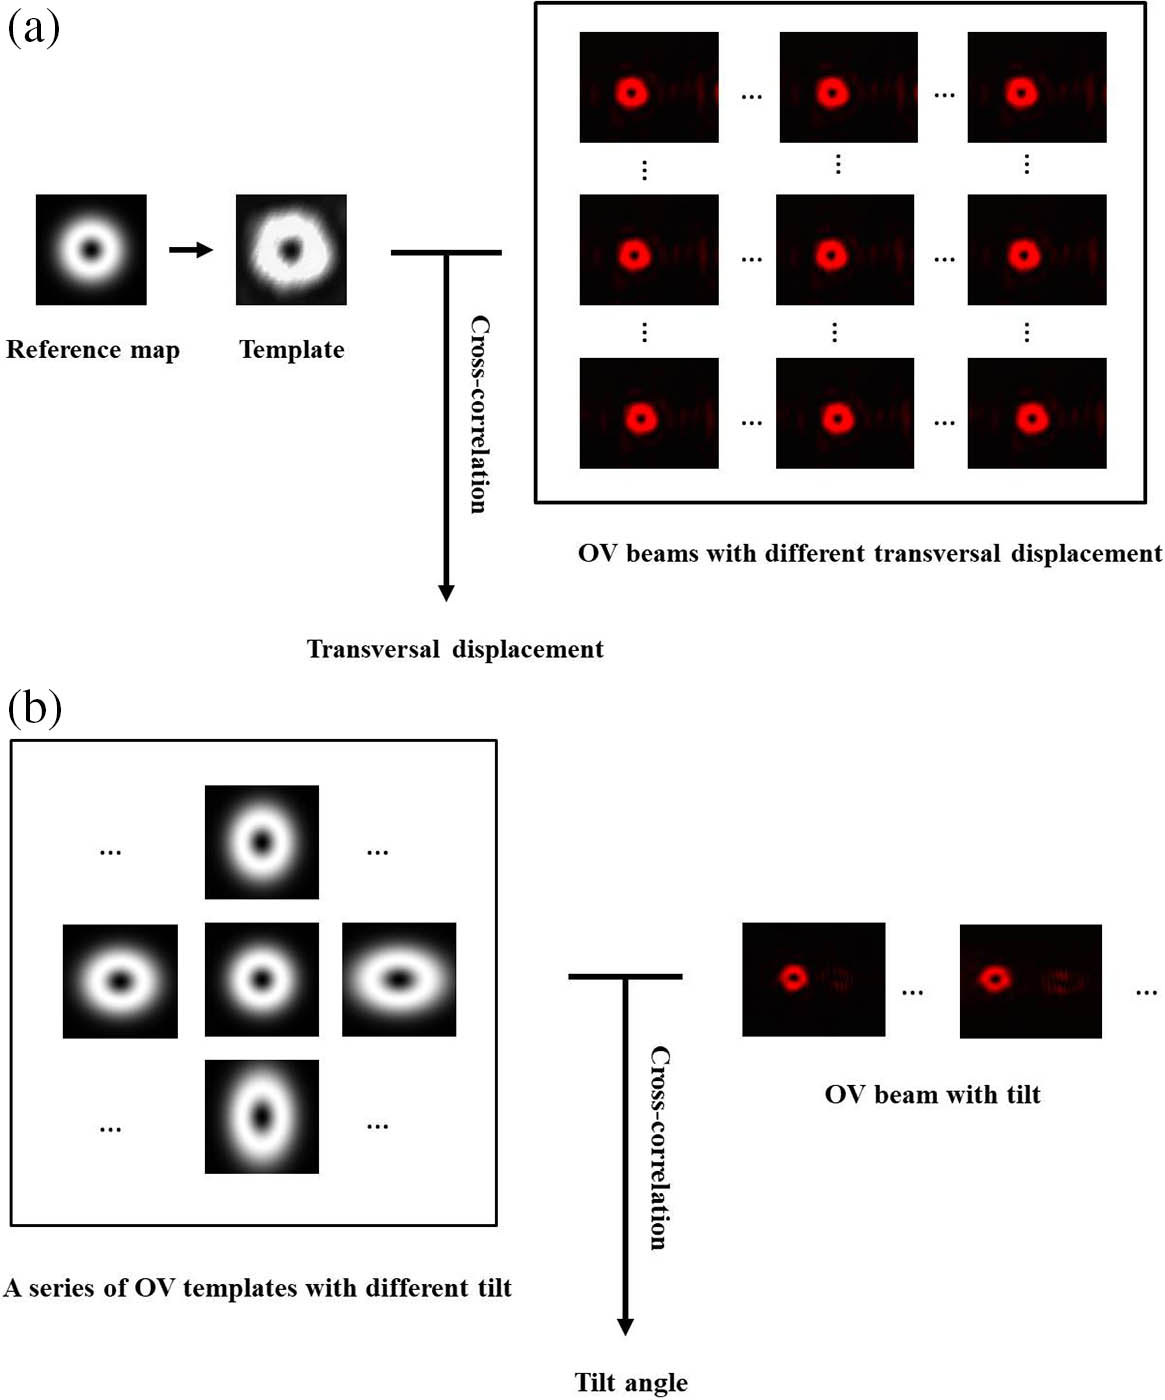
    Fig. 2. Flowcharts for measurement of misalignments of the OV beam. (a) Transversal displacements of various OV maps as captured by our experimental setup and measured using the cross-correlation algorithm. A template of an OV beam is obtained by performing a cross-correlation between a reference OV map simulated according to the experimental conditions and an OV map with no transversal displacement. (b) The tilt of the OV map can be determined by simulating a set of OV templates with set tilt angles and then cycling them with OV maps that have a tilt obtained using our method.
    Schematic of the experimental setup. In our system, a collimated laser beam is reflected by the spatial light modulator (SLM) to form an OV beam, and its image is acquired by a CCD camera. Adjustment of the optical 3D translation platform or the rotating platform beneath the CCD is performed to generate transversal displacement or tilt, respectively. The polarizer and spatial filter are used to collimate the laser beam. The SLM is used to transform the laser beam into an OV beam. The prism is a beam splitter. The blocker is used to block the laser beam. The CCD is used to image the OV beams with the different misalignments.
    Fig. 3. Schematic of the experimental setup. In our system, a collimated laser beam is reflected by the spatial light modulator (SLM) to form an OV beam, and its image is acquired by a CCD camera. Adjustment of the optical 3D translation platform or the rotating platform beneath the CCD is performed to generate transversal displacement or tilt, respectively. The polarizer and spatial filter are used to collimate the laser beam. The SLM is used to transform the laser beam into an OV beam. The prism is a beam splitter. The blocker is used to block the laser beam. The CCD is used to image the OV beams with the different misalignments.
    Curves of cross-correlation of transversal displacements, where the red curve represents the original OV map with no transversal displacement, and the green curve is the OV map with the different transversal displacements. (a) Correlation coefficient curve for 10 μm transversal displacement; (b) correlation coefficient curve for 20 μm transversal displacement; (c) correlation coefficient curve for 50 μm transversal displacement; and (d) correlation coefficient curve for 100 μm transversal displacement.
    Fig. 4. Curves of cross-correlation of transversal displacements, where the red curve represents the original OV map with no transversal displacement, and the green curve is the OV map with the different transversal displacements. (a) Correlation coefficient curve for 10μm transversal displacement; (b) correlation coefficient curve for 20μm transversal displacement; (c) correlation coefficient curve for 50μm transversal displacement; and (d) correlation coefficient curve for 100μm transversal displacement.
    Curves of the cross-correlation of tilt, where the green curve represents the OV map with specific angles produced by cycling our algorithm with the reference maps of different tilts ranging from 15° to 35°, and where the maximum of each curve is marked using a red square. (a) Correlation coefficient curve of 15° tilt; (b) correlation coefficient curve of 20° tilt; (c) correlation coefficient curve of 25° tilt; and (d) correlation coefficient curve of 30° tilt.
    Fig. 5. Curves of the cross-correlation of tilt, where the green curve represents the OV map with specific angles produced by cycling our algorithm with the reference maps of different tilts ranging from 15° to 35°, and where the maximum of each curve is marked using a red square. (a) Correlation coefficient curve of 15° tilt; (b) correlation coefficient curve of 20° tilt; (c) correlation coefficient curve of 25° tilt; and (d) correlation coefficient curve of 30° tilt.
    Xin Yang, Shibiao Wei, Shanshan Kou, Fei Yuan, En Cheng. Misalignment measurement of optical vortex beam in free space[J]. Chinese Optics Letters, 2019, 17(9): 090604
    Download Citation