
Jia-Wei Chen, Jin-Dong Wang, Xing-Hua Qu, Fu-Min Zhang. Analysis of main parameters of spectral interferometry ranging using optical frequency comb and animproved data processing method [J]. Acta Physica Sinica, 2019, 68(19): 190602-1
- Acta Physica Sinica
- Vol. 68, Issue 19, 190602-1 (2019)
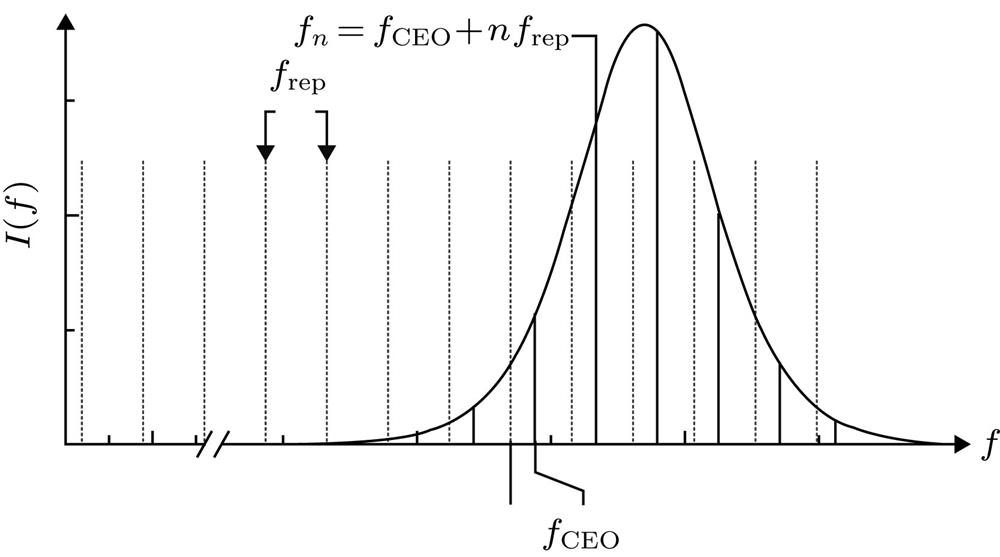
Fig. 1. Spectrum of optical frequency comb光频梳频谱
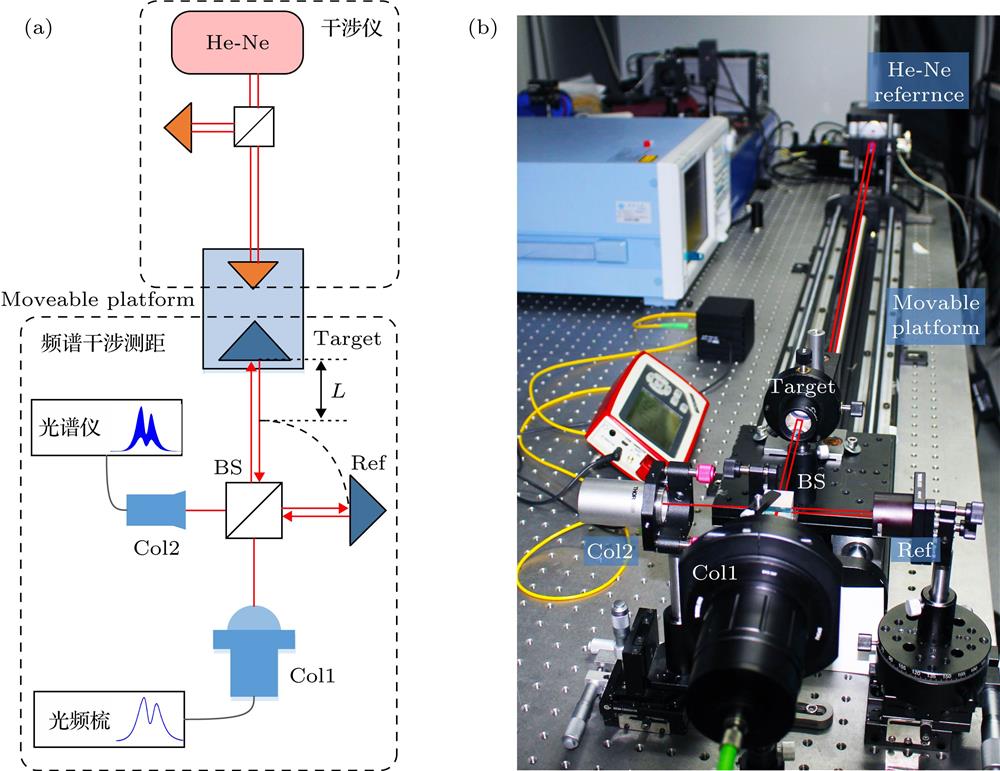
Fig. 2. (a) Principle of frequency domain interference method; (b) the experimental setup of the measurement system(a)频域干涉法原理图; (b) 测距系统实物图
Fig. 3. Relationship between actual distance and measured distance实测距离与被测距离关系
Fig. 4. Broadening of the pulse envelope using original FFT: (a)
; (b)
.
传统FFT法脉冲包络展宽现象 (a)
; (b)
Fig. 5. Principle of equal frequency interval resampling等频率间隔重采样原理
Fig. 6. Repetition and hopping of the measurement result传统FFT法结果重复和跳变
Fig. 7. Comparison of simulation effect when τ = 3 × 10–11: (a) Equal frequency interval resampling; (b) peak position fitting
当τ = 3 × 10–11时, 仿真效果对比 (a) 等频率间隔重采样; (b) 峰值位置拟合
Fig. 8. Peak position fitting simulation. Original FFT: (a) 3.335 × 10⁻¹², (b) 3.335 × 10⁻¹¹, (c) 7.500 × 10⁻¹¹. Equal frequency interval resampling and peak position fitting (d) 3.335 × 10⁻¹², (e) 3.335 × 10⁻¹¹, (f) 7.500 × 10⁻¹¹峰值定位仿真传统FFT (a) 3.335 × 10⁻¹², (b) 3.335 × 10⁻¹¹, (c) 7.500 × 10⁻¹¹; 等频率间隔重采样和峰值位置拟合(d) 3.335 × 10⁻¹², (e) 3.335 × 10⁻¹¹, (f) 7.500 × 10⁻¹¹
Fig. 9. Simulation error of three methods传统FFT、等频率间隔重采样和峰值位置拟合法仿真误差比较
Fig. 10. Effect contrast of peak position fitting. Original FFT: (a) L = 5.8600 mm, (b) L = 16.9850 mm, (c) L = 27.9100 mm. Equal frequency interval resampling and peak position fitting: (d) L = 5.8600 mm, (e) L = 16.9850 mm, (f) L = 27.9100 mm
峰值定位效果对比仅传统FFT (a) L = 5.8600 mm, (b) L = 16.9850 mm, (c) L = 27.9100 mm; 等频率间隔重采样和峰值位置拟合(d) L = 5.8600 mm, (e) L = 16.9850 mm, (f) L = 27.9100 mm
Fig. 11. Correction of repetition result by three methods: (a) 0.4997 mm; (b) 0.9998 mm; (c) 4.9980 mm传统FFT、等频率间隔重采样和峰值位置拟合法分辨力修正效果对比 (a) 0.4997 mm; (b) 0.9998 mm; (c) 4.9980 mm
|
Table 1.
Simulation error comparison of three methods.
传统FFT、等频率间隔重采样和峰值位置拟合法仿真结果误差比较
|
Table 2.
Measurement results of different distance.
传统FFT、等频率间隔重采样和峰值位置拟合法误差比较

Set citation alerts for the article
Please enter your email address
© Copyright 2018-2021 | Chinese Laser Press. All Rights Reserved 沪ICP备15018463号-20