• Laser & Optoelectronics Progress
  • Vol. 59, Issue 16, 1610001 (2022)
Mengkai Yuan1, Xinjun Zhu2、*, and Linpeng Hou1
Author Affiliations
  • 1School of Control Science and Engineering, Tiangong University, Tianjin 300387, China
  • 2School of Artificial Intelligence, Tiangong University, Tianjin 300387, China
  • show less
    DOI: 10.3788/LOP202259.1610001 Cite this Article Set citation alerts
    Mengkai Yuan, Xinjun Zhu, Linpeng Hou. Depth Estimation from Single-Frame Fringe Projection Patterns Based on R2U-Net[J]. Laser & Optoelectronics Progress, 2022, 59(16): 1610001 Copy Citation Text show less
    Recurrent residual convolutional neural network based on U-Net
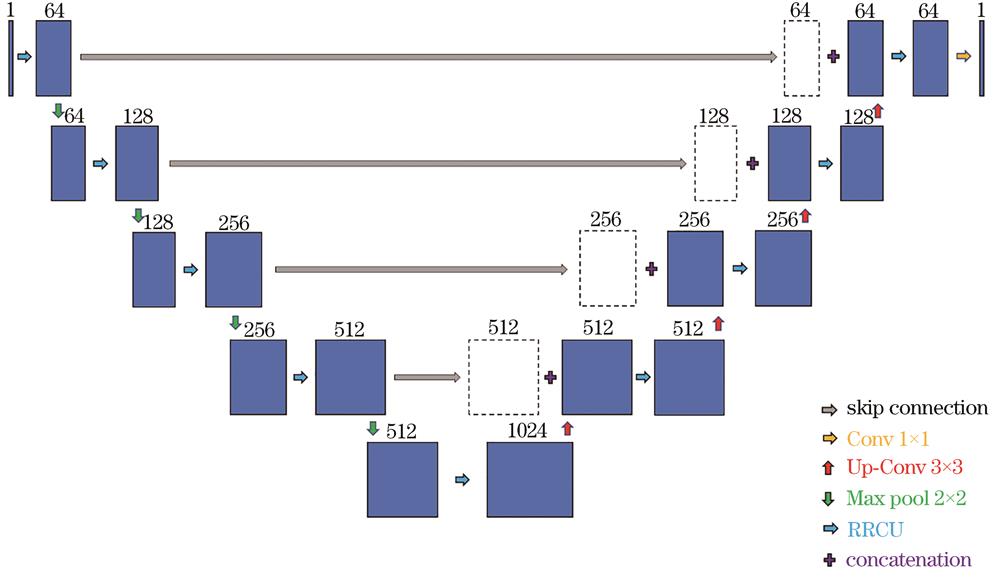
    Fig. 1. Recurrent residual convolutional neural network based on U-Net
    Recurrent residual convolutional units and unfolded recurrent convolutional units
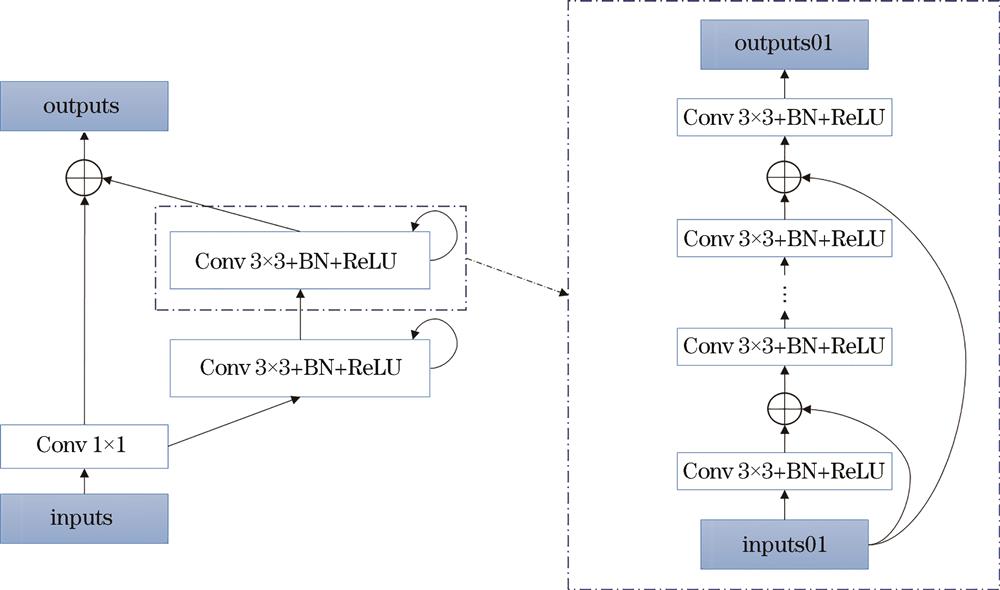
    Fig. 2. Recurrent residual convolutional units and unfolded recurrent convolutional units
    Schematic diagram of proposed algorithm
    Fig. 3. Schematic diagram of proposed algorithm
    Simulated projection fringe pattern and simulated depth map. (a) Simulated projection fringe pattern; (b) simulated depth map
    Fig. 4. Simulated projection fringe pattern and simulated depth map. (a) Simulated projection fringe pattern; (b) simulated depth map
    Simulated training dataset
    Fig. 5. Simulated training dataset
    Error of R2U-Net and U-Net under free noise testing samples
    Fig. 6. Error of R2U-Net and U-Net under free noise testing samples
    Depth map prediction result of simulated data. (a) Simulated fringe pattern of test input; (b) depth map corresponding to fringe pattern; (c) prediction result of U-Net; (d) prediction result of R2U-Net; (e) comparison of 270th row of prediction result
    Fig. 7. Depth map prediction result of simulated data. (a) Simulated fringe pattern of test input; (b) depth map corresponding to fringe pattern; (c) prediction result of U-Net; (d) prediction result of R2U-Net; (e) comparison of 270th row of prediction result
    Comparison of R2U-Net method and FTM method. (a) Depth map corresponding to fringe pattern; (b) prediction result of R2U-Net; (c) result of FTM; (d) comparison of the 270th row of the prediction result
    Fig. 8. Comparison of R2U-Net method and FTM method. (a) Depth map corresponding to fringe pattern; (b) prediction result of R2U-Net; (c) result of FTM; (d) comparison of the 270th row of the prediction result
    Error of R2U-Net and U-Net under noisy testing samples
    Fig. 9. Error of R2U-Net and U-Net under noisy testing samples
    Depth map prediction result of noise simulated data. (a) Simulated fringe pattern of test input; (b) depth map corresponding to fringe pattern; (c) prediction result of U-Net; (d) prediction result of R2U-Net; (e) comparison of 270th row of prediction result
    Fig. 10. Depth map prediction result of noise simulated data. (a) Simulated fringe pattern of test input; (b) depth map corresponding to fringe pattern; (c) prediction result of U-Net; (d) prediction result of R2U-Net; (e) comparison of 270th row of prediction result
    Comparison of R2U-Net method and FTM method (Noise simulation data). (a) Depth map corresponding to fringe pattern; (b) prediction result of R2U-Net; (c) result of FTM; (d) comparison of 270th row of prediction result
    Fig. 11. Comparison of R2U-Net method and FTM method (Noise simulation data). (a) Depth map corresponding to fringe pattern; (b) prediction result of R2U-Net; (c) result of FTM; (d) comparison of 270th row of prediction result
    Experimental training dataset
    Fig. 12. Experimental training dataset
    Error of R2U-Net and U-Net under experimental testing samples
    Fig. 13. Error of R2U-Net and U-Net under experimental testing samples
    Depth map prediction result of experimental sample. (a) Experimental fringe pattern of test input; (b) depth map corresponding to fringe pattern; (c) prediction result of U-Net; (d) prediction result of R2U-Net; (e) comparison of 310th row of prediction result
    Fig. 14. Depth map prediction result of experimental sample. (a) Experimental fringe pattern of test input; (b) depth map corresponding to fringe pattern; (c) prediction result of U-Net; (d) prediction result of R2U-Net; (e) comparison of 310th row of prediction result
    Depth map prediction result of the second experimental sample. (a) Simulated fringe pattern of the test input; (b) depth map corresponding to fringe pattern; (c) prediction result of U-Net; (d) prediction result of R2U-Net; (e) comparison of 320th row of prediction result
    Fig. 15. Depth map prediction result of the second experimental sample. (a) Simulated fringe pattern of the test input; (b) depth map corresponding to fringe pattern; (c) prediction result of U-Net; (d) prediction result of R2U-Net; (e) comparison of 320th row of prediction result
    Loss functionMSE
    MSE1.71×10-6
    SSIM2.22×10-6
    SSIM-MAE2.17×10-6
    Table 1. Comparison of three loss functions
    ModelMAESSIMMSE
    U-Net8.62×10-30.984951.24×10-3
    R2U-Net7.12×10-30.987751.08×10-3
    Table 2. Performance evaluation of the two models
    Mengkai Yuan, Xinjun Zhu, Linpeng Hou. Depth Estimation from Single-Frame Fringe Projection Patterns Based on R2U-Net[J]. Laser & Optoelectronics Progress, 2022, 59(16): 1610001
    Download Citation