• Photonics Research
  • Vol. 12, Issue 2, 194 (2024)
Jiaming Lyu1, Lihao Huang1, Lin Chen1、2、*, Yiming Zhu1、3, and Songlin Zhuang1
Author Affiliations
  • 1THz Technology Innovation Research Institute, Shanghai Key Laboratory of Modern Optical System, University of Shanghai for Science and Technology, Shanghai 200093, China
  • 2Shanghai Institute of Intelligent Science and Technology, Tongji University, Shanghai 200092, China
  • 3e-mail: ymzhu@usst.edu.cn
  • show less
    DOI: 10.1364/PRJ.508136 Cite this Article Set citation alerts
    Jiaming Lyu, Lihao Huang, Lin Chen, Yiming Zhu, Songlin Zhuang. Review on the terahertz metasensor: from featureless refractive index sensing to molecular identification[J]. Photonics Research, 2024, 12(2): 194 Copy Citation Text show less
    THz gap in the electromagnetic spectrum and corresponding vibration mode of biological molecules.
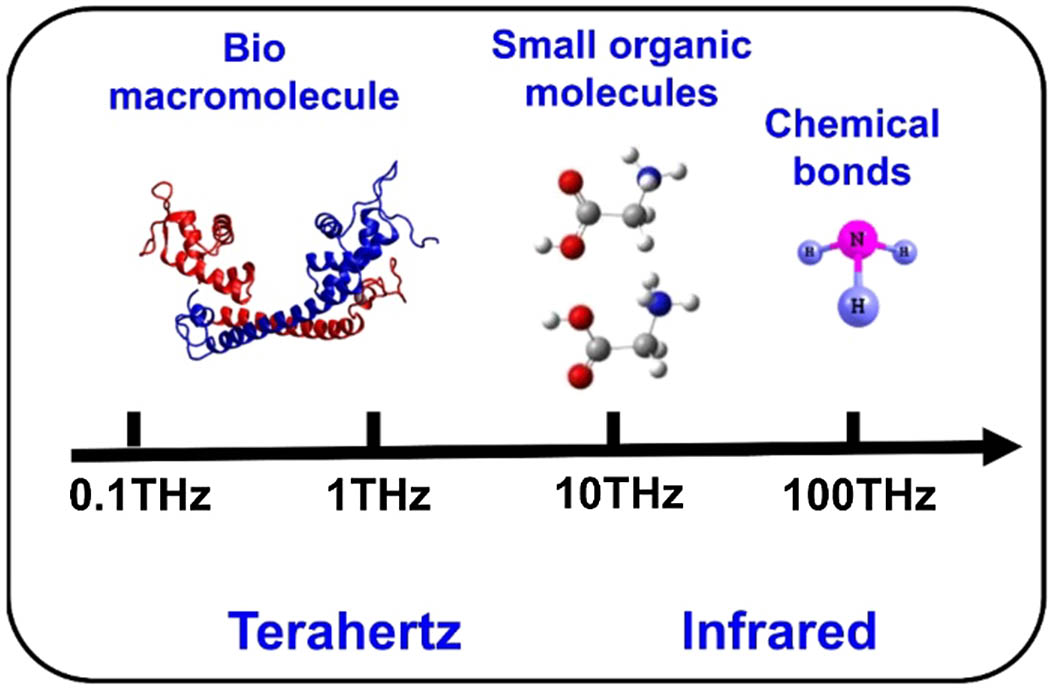
    Fig. 1. THz gap in the electromagnetic spectrum and corresponding vibration mode of biological molecules.
    Principles of the metasensor for versatile THz detection techniques.
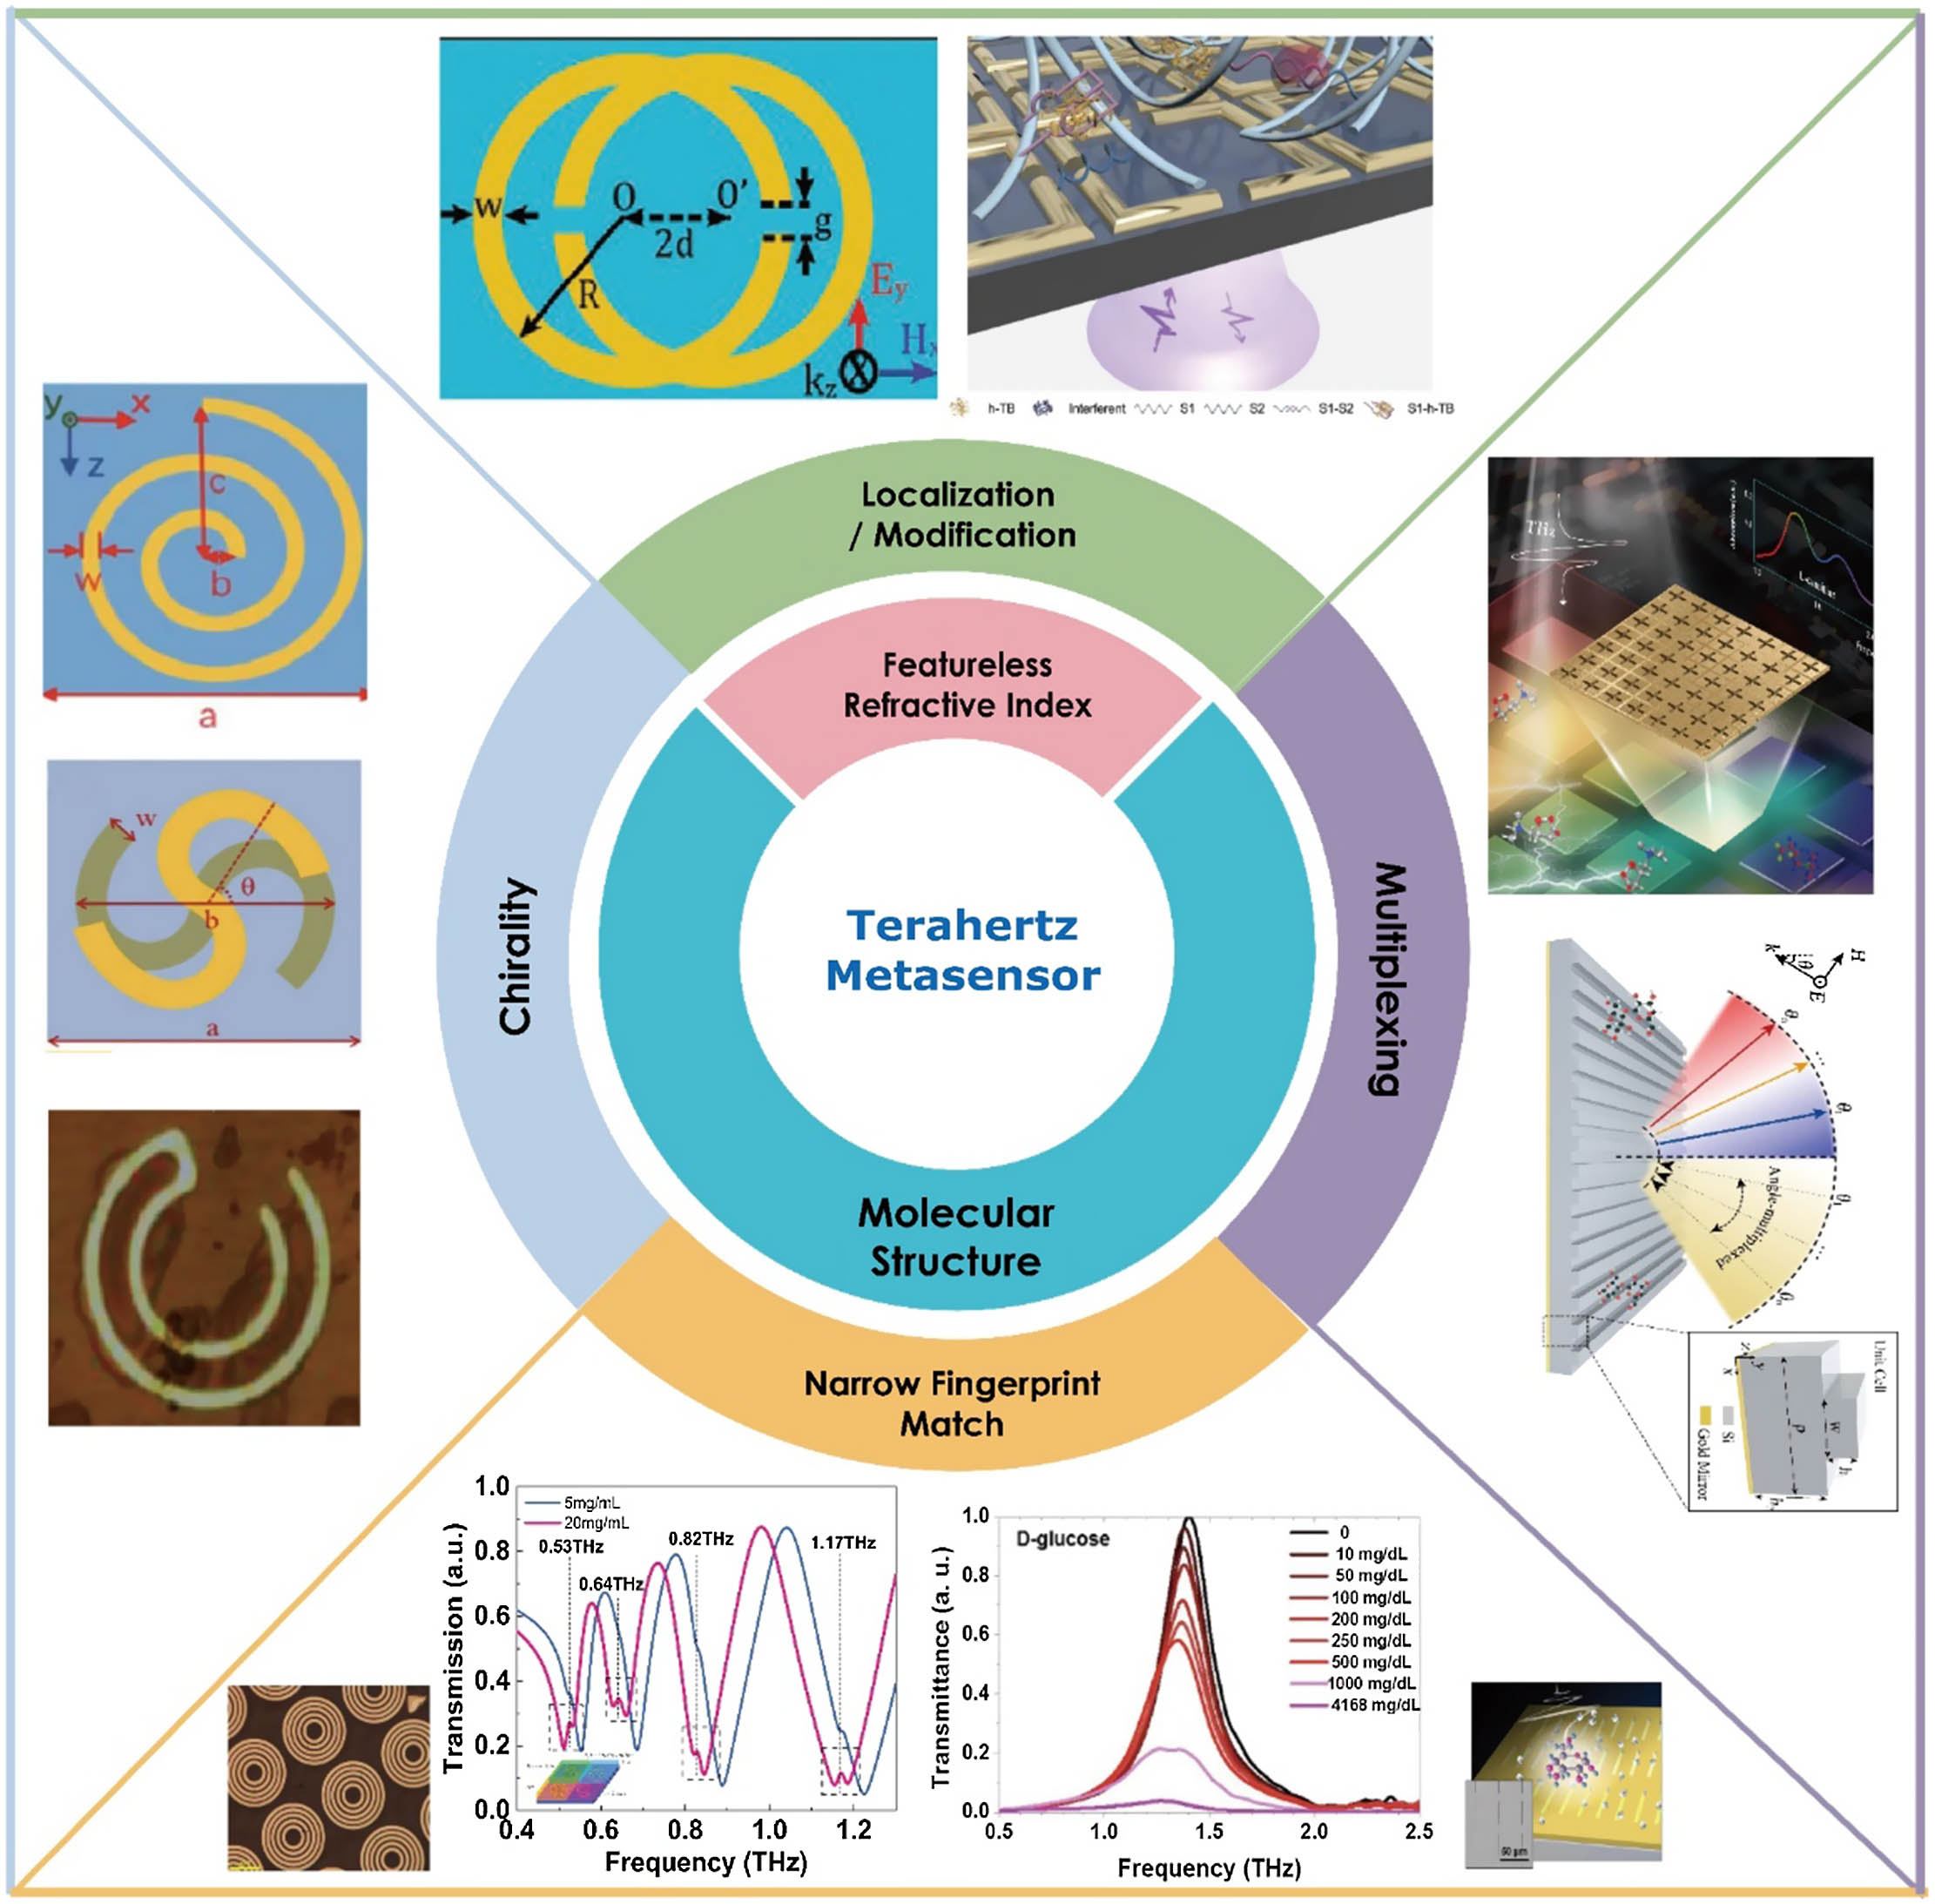
    Fig. 2. Principles of the metasensor for versatile THz detection techniques.
    Diagram principle of THz trace detection for different target information by metasensors.
    Fig. 3. Diagram principle of THz trace detection for different target information by metasensors.
    (a) Microscopic image of dual-torus toroidal metasensor and experimentally measured transmission spectra of mixed ethanol-water [64]. (b) Schematic model of the engineered cross-polarization four-arrowhead plasmonic nanostructure and transmittance spectra of a coronavirus-infected patient with a CT value of 21 [56]. (c) Schematic diagram of THz all dielectric metamaterial absorber and transmission spectra of chlorpyrifos with different concentration [75]. (d) Schematic diagram of the metasurface metal-insulator-metal (MIM) waveguide structure and experimental reflection spectra under refractive index variations [46]. (a) Reprinted with permission from Ref. [64], copyright 2021, John Wiley; (b) reprinted with permission from Ref. [56], copyright 2022, American Chemical Society; (c) reprinted with permission from Ref. [75], copyright 2020, Elsevier.
    Fig. 4. (a) Microscopic image of dual-torus toroidal metasensor and experimentally measured transmission spectra of mixed ethanol-water [64]. (b) Schematic model of the engineered cross-polarization four-arrowhead plasmonic nanostructure and transmittance spectra of a coronavirus-infected patient with a CT value of 21 [56]. (c) Schematic diagram of THz all dielectric metamaterial absorber and transmission spectra of chlorpyrifos with different concentration [75]. (d) Schematic diagram of the metasurface metal-insulator-metal (MIM) waveguide structure and experimental reflection spectra under refractive index variations [46]. (a) Reprinted with permission from Ref. [64], copyright 2021, John Wiley; (b) reprinted with permission from Ref. [56], copyright 2022, American Chemical Society; (c) reprinted with permission from Ref. [75], copyright 2020, Elsevier.
    Strategy and specificity of employing different materials modified with metasensor to achieve analyte-specific binding: (a) metal nanoparticle [87]; (b) graphene [91]; (c) antibody [92]; (d) hydrogel [93]; (e) MIP [94]. (a) Reprinted with permission from Ref. [87], copyright 2021, Elsevier; (b) reprinted with permission from Ref. [91], copyright 2021, Elsevier; (c) reprinted with permission from Ref. [92], copyright 2022, Elsevier; (d) reprinted with permission from Ref. [93], copyright 2021, American Chemical Society; (e) reprinted with permission from Ref. [94], copyright 2023, Elsevier.
    Fig. 5. Strategy and specificity of employing different materials modified with metasensor to achieve analyte-specific binding: (a) metal nanoparticle [87]; (b) graphene [91]; (c) antibody [92]; (d) hydrogel [93]; (e) MIP [94]. (a) Reprinted with permission from Ref. [87], copyright 2021, Elsevier; (b) reprinted with permission from Ref. [91], copyright 2021, Elsevier; (c) reprinted with permission from Ref. [92], copyright 2022, Elsevier; (d) reprinted with permission from Ref. [93], copyright 2021, American Chemical Society; (e) reprinted with permission from Ref. [94], copyright 2023, Elsevier.
    Significant amplitude/frequency shift change induced by fingerprint. (a) Schematic diagram of sugar molecules using the nano-antenna array-based metamaterial and THz transmission spectra for D-glucose and sucrose molecules [107]. (b) Schematic illustration of THz sensing using photonic crystal cavity and the transmittance spectra of lactose with different thicknesses coated on the PTFE substrate inserted into the cavity [108]. (c) The schematic of THz metasensor and the relationships between the frequency shifts of the resonance peaks and the concentrations of three pesticides. The matching degree between the resonance peak of the structure and the fingerprint peaks of the pesticides determines value of frequency shift [109].
    Fig. 6. Significant amplitude/frequency shift change induced by fingerprint. (a) Schematic diagram of sugar molecules using the nano-antenna array-based metamaterial and THz transmission spectra for D-glucose and sucrose molecules [107]. (b) Schematic illustration of THz sensing using photonic crystal cavity and the transmittance spectra of lactose with different thicknesses coated on the PTFE substrate inserted into the cavity [108]. (c) The schematic of THz metasensor and the relationships between the frequency shifts of the resonance peaks and the concentrations of three pesticides. The matching degree between the resonance peak of the structure and the fingerprint peaks of the pesticides determines value of frequency shift [109].
    Equivalent AIT model. (a) Level scheme of a hybrid system composed of a cross slot metamaterial and molecular medium. (b) Equivalent resonance oscillator model [111].
    Fig. 7. Equivalent AIT model. (a) Level scheme of a hybrid system composed of a cross slot metamaterial and molecular medium. (b) Equivalent resonance oscillator model [111].
    THz metasensing specificity based on the AIT effect: (a) schematic diagram of vibrations detection of L-tartaric acid molecule using THz metamaterial and AIT effect in normalized transmission spectra [115]; (b) schematic diagram of the antenna array on silicon substrate, electric field (Ex) of the antenna array at the dip frequency, and AIT effect in transmission spectra of the antenna array after 1 μm lactose deposition [116]; (c) optical microscopy image of 5-order concentric rings metasensor and simultaneous AIT effect in four resonances by measuring mixture of four different chemicals at the same time with concentrations of 5 mg/mL and 20 mg/mL [51]. (b) Reprinted with permission from Ref. [116], copyright 2019, Optica Publishing Group; (c) reprinted with permission from Ref. [51], copyright 2024, Elsevier.
    Fig. 8. THz metasensing specificity based on the AIT effect: (a) schematic diagram of vibrations detection of L-tartaric acid molecule using THz metamaterial and AIT effect in normalized transmission spectra [115]; (b) schematic diagram of the antenna array on silicon substrate, electric field (Ex) of the antenna array at the dip frequency, and AIT effect in transmission spectra of the antenna array after 1 μm lactose deposition [116]; (c) optical microscopy image of 5-order concentric rings metasensor and simultaneous AIT effect in four resonances by measuring mixture of four different chemicals at the same time with concentrations of 5 mg/mL and 20 mg/mL [51]. (b) Reprinted with permission from Ref. [116], copyright 2019, Optica Publishing Group; (c) reprinted with permission from Ref. [51], copyright 2024, Elsevier.
    THz metamaterial multiplexing sensing experiment: (a) experimental angle-multiplexed fingerprint metasensing scheme and the maximum enhancement is up to 98 times for thin film α-lactose [119]; (b) optical images of the fabricated FSFS, 36-pixel location (P1–P36 correspond to L from 104 μm to 47 μm) for crossed-slot structure and measured transmission spectra of coating 10 μm thick D-carnitine and L-carnitine on the FSFS and envelop absorbance signals of D-carnitine and L-carnitine [44].
    Fig. 9. THz metamaterial multiplexing sensing experiment: (a) experimental angle-multiplexed fingerprint metasensing scheme and the maximum enhancement is up to 98 times for thin film α-lactose [119]; (b) optical images of the fabricated FSFS, 36-pixel location (P1–P36 correspond to L from 104 μm to 47 μm) for crossed-slot structure and measured transmission spectra of coating 10 μm thick D-carnitine and L-carnitine on the FSFS and envelop absorbance signals of D-carnitine and L-carnitine [44].
    (a) Geometry of spiral chiral metasensor: the PEA, PRA, CD and OA spectra differences of D- and L-proline solutions with 0.6 g/mL and the polarization ellipses of output THz waves of D- and L-proline with 0.6 g/mL at 0.55 THz [121]. (b) Schematic diagram of the structure of all-dielectric metasurface and experimental transmission and CD spectra for L- and D-enantiomers with/without metasurface [122].
    Fig. 10. (a) Geometry of spiral chiral metasensor: the PEA, PRA, CD and OA spectra differences of D- and L-proline solutions with 0.6 g/mL and the polarization ellipses of output THz waves of D- and L-proline with 0.6 g/mL at 0.55 THz [121]. (b) Schematic diagram of the structure of all-dielectric metasurface and experimental transmission and CD spectra for L- and D-enantiomers with/without metasurface [122].
    (a), (b) Experimental setup for free space EO sampling [61]. (c), (d) Schematic of THz coherent photomixing spectrometer setup [56] and (e), (f) reflective mode angle-multiplexed THz-TDS system [119]. (a), (c), (e) Optical path diagram and configuration. (b), (d), (f) Corresponding photograph of the measuring platform. (a), (b) Reprinted with permission from Ref. [61], copyright 2019, Springer Nature; (c), (d) reprinted with permission from Ref. [56], copyright 2022, American Chemical Society; (e), (f) reprinted with permission from Ref. [119], copyright 2023, IEEE.
    Fig. 11. (a), (b) Experimental setup for free space EO sampling [61]. (c), (d) Schematic of THz coherent photomixing spectrometer setup [56] and (e), (f) reflective mode angle-multiplexed THz-TDS system [119]. (a), (c), (e) Optical path diagram and configuration. (b), (d), (f) Corresponding photograph of the measuring platform. (a), (b) Reprinted with permission from Ref. [61], copyright 2019, Springer Nature; (c), (d) reprinted with permission from Ref. [56], copyright 2022, American Chemical Society; (e), (f) reprinted with permission from Ref. [119], copyright 2023, IEEE.
    (a) Flow chart of metamaterial sensor processing and preparation by photolithography [52]. (b) Schematic view of fabrication flow of 3D printing with stereolithography. In the first approach (first row in the figure), the top surface of mushroom MEGO was coated with conductive paste (stamping method). In the second approach (second row in the figure), metal was sputtered on the whole 3D printed device. The device was submerged in etchant to etch away the existing metal on the pedestal and the substrate [138]. (c) Left side, the schematic of the ps laser micromachining system; right side, the metamaterial fabrication steps [109].
    Fig. 12. (a) Flow chart of metamaterial sensor processing and preparation by photolithography [52]. (b) Schematic view of fabrication flow of 3D printing with stereolithography. In the first approach (first row in the figure), the top surface of mushroom MEGO was coated with conductive paste (stamping method). In the second approach (second row in the figure), metal was sputtered on the whole 3D printed device. The device was submerged in etchant to etch away the existing metal on the pedestal and the substrate [138]. (c) Left side, the schematic of the ps laser micromachining system; right side, the metamaterial fabrication steps [109].
    (a) Enhanced absorption fingerprint spectrum based on THz graphene assisted frequency-agile metasurface; the absorptance is improved as much as nearly 5 times [149]. (b) The reconfigurable multiplexed metasensor by angle and thickness multiplexing; broadband absorbance enhancement factor is 79 times [150]. (c) Molecular fingerprint detection using THz metasurface array; L-glutamate molecular fingerprint retrieval from the measurement of metasensor array (blue curve) and transmission-absorption spectroscopy (red curve) [151]. (d) Photograph of the microfluidic sample cell assembled with the THz EIT meta-sensor; experimental results of the transmission spectra and classification results for VOCs by using PCA-GMM [152]. (e) Schematic of a graphene sensor for reflective sensing of pesticide molecules with a concentration of 0.60 mg/L on the surface of an apple [153]. (f) Schematic figure of COF THz absorber; reflectance changes (0.97 THz) of different pesticide residue molecules at 50 ng on the apple [154]. (a) Reprinted with permission from Ref. [149], copyright 2022, Royal Society of Chemistry; (b) reprinted with permission from [150], copyright 2023, IEEE; (c) reprinted with permission from Ref. [151], copyright 2024, Elsevier; (d) reprinted with permission from Ref. [152], copyright 2023, IEEE; (e) reprinted with permission from Ref. [153], copyright 2020, American Chemistry Society; (f) reprinted with permission from Ref. [154], copyright 2022, Elsevier.
    Fig. 13. (a) Enhanced absorption fingerprint spectrum based on THz graphene assisted frequency-agile metasurface; the absorptance is improved as much as nearly 5 times [149]. (b) The reconfigurable multiplexed metasensor by angle and thickness multiplexing; broadband absorbance enhancement factor is 79 times [150]. (c) Molecular fingerprint detection using THz metasurface array; L-glutamate molecular fingerprint retrieval from the measurement of metasensor array (blue curve) and transmission-absorption spectroscopy (red curve) [151]. (d) Photograph of the microfluidic sample cell assembled with the THz EIT meta-sensor; experimental results of the transmission spectra and classification results for VOCs by using PCA-GMM [152]. (e) Schematic of a graphene sensor for reflective sensing of pesticide molecules with a concentration of 0.60 mg/L on the surface of an apple [153]. (f) Schematic figure of COF THz absorber; reflectance changes (0.97 THz) of different pesticide residue molecules at 50 ng on the apple [154]. (a) Reprinted with permission from Ref. [149], copyright 2022, Royal Society of Chemistry; (b) reprinted with permission from [150], copyright 2023, IEEE; (c) reprinted with permission from Ref. [151], copyright 2024, Elsevier; (d) reprinted with permission from Ref. [152], copyright 2023, IEEE; (e) reprinted with permission from Ref. [153], copyright 2020, American Chemistry Society; (f) reprinted with permission from Ref. [154], copyright 2022, Elsevier.
    Analyte InformationPrinciplesHighlightsConcerns
    Featureless Refractive indexSensitivity enhancement by different localized modeHigh sensitivity depending on high Q and FoM modeWithout fingerprint spectrum information
    Specifically modified by different materialSpecific detection due to material-target bindingNot specific to THz wave, lacking spectroscopic fingerprints
    Molecular structureNarrow fingerprint matchSpecific fingerprint detection for certain frequencyMatching between the structure and target analyte
    MultiplexingBroadband fingerprint spectrum amplitude enhancementComplex metasensor fabrication/manipulation
    ChiralitySpecific circular dichroism/chiral spectrum by chiral metasensorComplex experiment setup, chiral molecule selectivity
    Table 1. Highlights and Concerns of Different Target Information Detections with THz Metasensors
    TechniquePrinciplesMetasensor Resonant FrequenciesAnalytesSensitivity/Enhancement FactorTimelineReferences
    Featureless refractive indexSensitivity enhancement by different localized mode0.55 THz (toroidal)Ethanol-water solution124.3 GHz/RIU (experiment)2021[64]
    0.81 THz (LC)COVID-1945 GHz μm2 (experiment)2022[56]
    0.93 THz (cylindrical SPPs/bound mode)Chlorpyrifos0.1 mg/L (LoD) (experiment)2020[75]
    0.76 THz and 1.28 THz (dipole & F-P mode)Bovine serum albumin (BSA)0.47/RIU and2019[52]
    0.51/RIU (experiment)
    Specific modification by different material0.735 THz (gold-nanoparticles)miRNA14.54 aM (LoD) (experiment)2020[87]
    0.46 THz and 0.76 THz (graphene)Escherichia coli O157:H70.1 mg/L (experiment)2021[91]
    0.754 THz (protein antibody)CA125 and CA1994.2 fM (LoD) (experiment)2022[92]
    0.912 THz (hydrogel)Human α-thrombin0.40 pM (LoD) (experiment)2021[93]
    0.849 THz (molecularly imprinted polymer)n-propanol gas50–500 ppm (LoD) (experiment)2023[94]
    Molecular structureNarrow fingerprint match1.4 THz (resonance matching)D-glucose10 mg/dL (glucose) (experiment)2015[107]
    Fructose
    Sucrose
    529.2 GHz (resonance matching)Lactose31 times (theory)2019[108]
    0.92 THz (resonance matching)Chlorothalonil5.7 GHz/(g/L)2022[109]
    Pyraclostrobin11.9 GHz/(g/L)
    Deltamethrin17.1 GHz/(g/L) (experiment)
    1.14 THz (AIT)L-tartaric4.5 dB (experiment)2018[115]
    0.53 THz (AIT)Lactose7.6 (transmission) 13 (reflection) (theory)2019[116]
    0.53 THz, 0.64 THz, 0.82 THz, and 1.17 THz (AIT)α-lactose, benzoic acid, vitamin B2, and 2,5-dichloroaniline8.61 mg/mL, 6.96 mg/mL, 7.54 mg/mL, and 8.35 mg/mL (LoD) (experiment)2024[51]
    Multiplexing0.5–0.55 THz (angle multiplexing)α-lactose, Ta2O598 times (experiment)2023[119]
    0.9–2 THz (geometry multiplexing)D-/L-carnitine7 times (experiment)2023[44]
    Chirality0.58 THz (metallic chiral metasensor)D-/L-proline105  g/mL (LoD) (experiment)2021[121]
    0.97 THz, 1.37 THz, and 1.63 THz (dielectric chiral metasensor)D-/L-tyrosine D-/L-arginine D-/L-cysteine11.4 times (experiment)2022[122]
    Table 2. Comparison of Selected Works Representing the Advances in THz Metasensors Development Based on Different Principles
    Jiaming Lyu, Lihao Huang, Lin Chen, Yiming Zhu, Songlin Zhuang. Review on the terahertz metasensor: from featureless refractive index sensing to molecular identification[J]. Photonics Research, 2024, 12(2): 194
    Download Citation