• Acta Optica Sinica
  • Vol. 41, Issue 7, 0712001 (2021)
Yunyun Wang1、2, Yanli Qiao2, Yangyu Li2、**, Tengxiao Guo3、*, Fangxiao Cui2, Jun Wu2, and Dacheng Li2
Author Affiliations
  • 1College of Environmental Science and Optoelectronic Technology, University of Science and Technology of China, Hefei, Anhui 230026, China
  • 2Key Laboratory of Optical Calibration and Characterization, Anhui Institute of Optics and Fine Mechanics, Hefei Institutes of Physical Science, Chinese Academy of Sciences, Hefei, Anhui 230031, China
  • 3State Key Laboratory of NBC Protection for Civilian, Beijing 102205, China
  • show less
    DOI: 10.3788/AOS202141.0712001 Cite this Article Set citation alerts
    Yunyun Wang, Yanli Qiao, Yangyu Li, Tengxiao Guo, Fangxiao Cui, Jun Wu, Dacheng Li. Research on Passive Infrared Signal Processing Method Based on Lock-in Amplifier[J]. Acta Optica Sinica, 2021, 41(7): 0712001 Copy Citation Text show less
    Schematic of passive detection of pollution gases
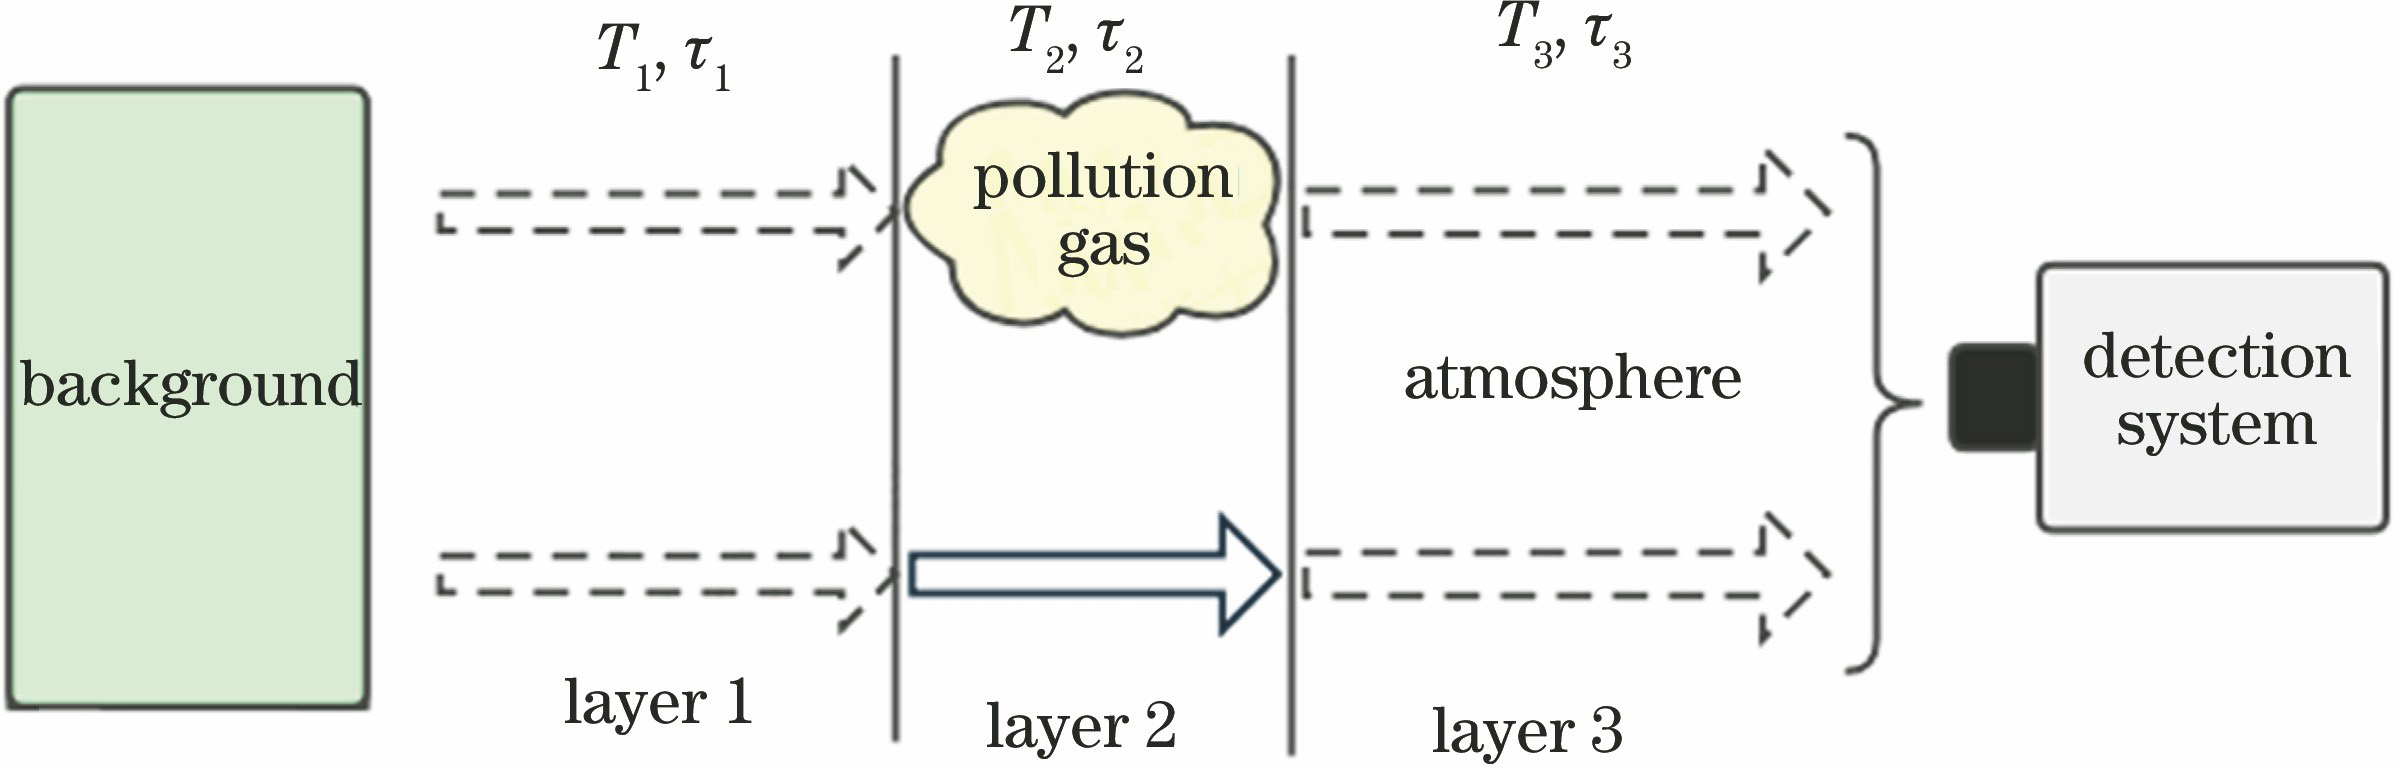
    Fig. 1. Schematic of passive detection of pollution gases
    Structure of detection system
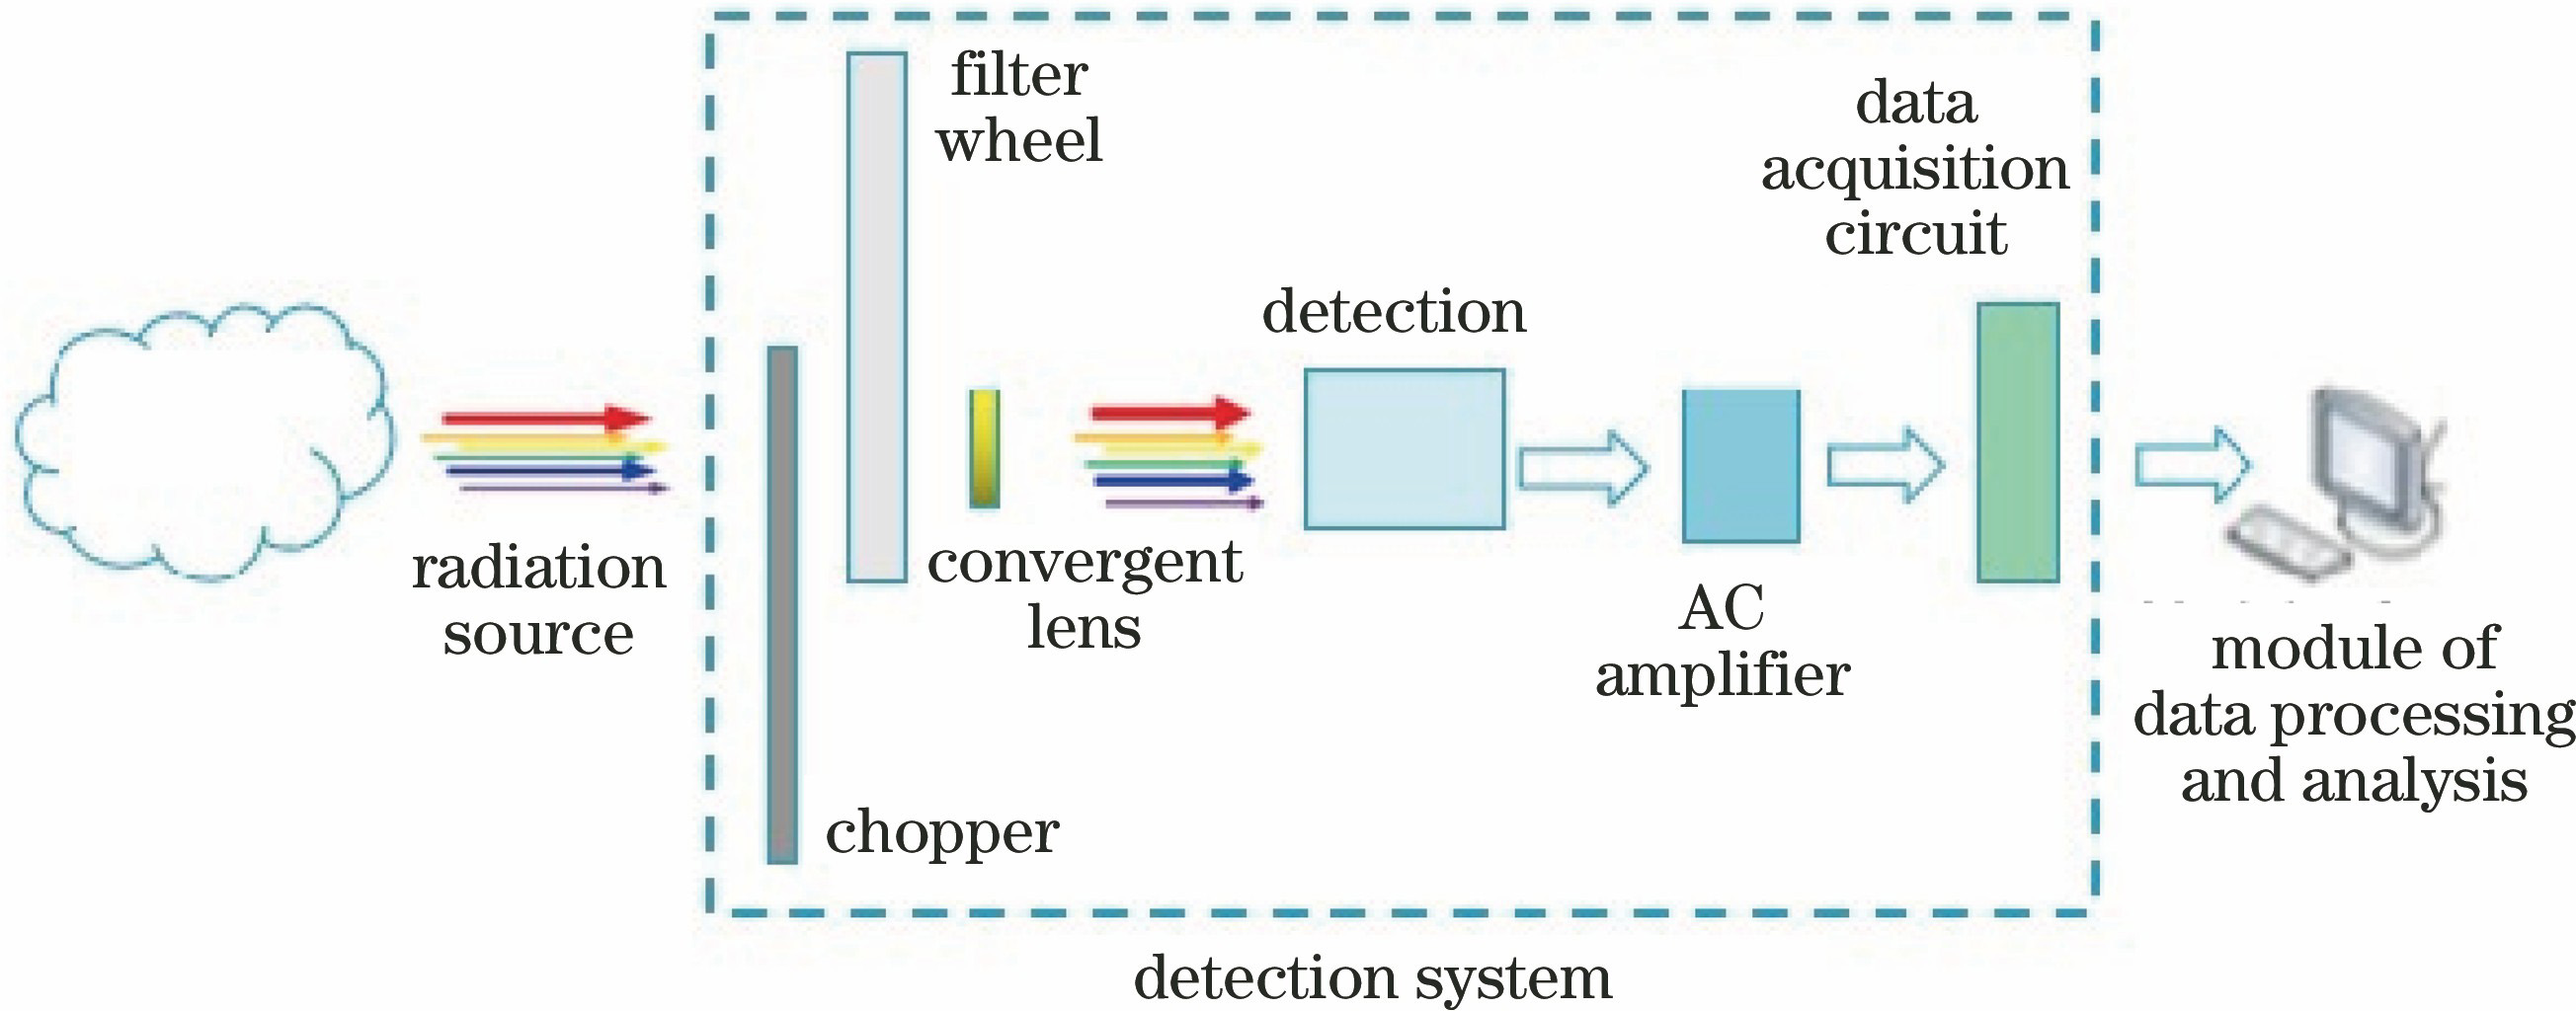
    Fig. 2. Structure of detection system
    Periodic change process of measuring optical path
    Fig. 3. Periodic change process of measuring optical path
    Signal waveform before and after AC amplifier. (a) Before AC amplifier;(b) after AC filter amplifier
    Fig. 4. Signal waveform before and after AC amplifier. (a) Before AC amplifier;(b) after AC filter amplifier
    Experimental device of detection system
    Fig. 5. Experimental device of detection system
    Spectral response curve of each channel and detector
    Fig. 6. Spectral response curve of each channel and detector
    Phase lock-in value curve of each channel measurement signal. (a) Without phase judgment; (b) adding phase judgment
    Fig. 7. Phase lock-in value curve of each channel measurement signal. (a) Without phase judgment; (b) adding phase judgment
    Radiance curve of blackbody and corresponding radiation values of each channel in different target radiation scenarios. (a) Without phase judgment; (b) adding phase judgment
    Fig. 8. Radiance curve of blackbody and corresponding radiation values of each channel in different target radiation scenarios. (a) Without phase judgment; (b) adding phase judgment
    ItemParameter
    DetectorPhotoconductive HgCdTe
    ChopperFrequency f=100 Hz
    Filter 1λc=7850 nm, w=185 nm
    Filter 2λc=9662 nm, w=200 nm
    Filter 3λc=10350 nm, w=200 nm
    Filter 3λc=11300 nm, w=240 nm
    Table 1. Parameters of experimental device
    Blackbody temperature /℃Radiation of channel 1 /(W·m-2·sr-1·μm-1)
    Before correctionAfter correctionTheoretical value
    510.0775.5395.559
    109.3486.2056.241
    158.5406.9716.980
    207.7917.7057.774
    258.6088.6088.631
    309.5189.5189.547
    3510.49310.49310.530
    Table 2. Comparison of radiation value of channel 1 before and after correction with theoretical value of model
    Yunyun Wang, Yanli Qiao, Yangyu Li, Tengxiao Guo, Fangxiao Cui, Jun Wu, Dacheng Li. Research on Passive Infrared Signal Processing Method Based on Lock-in Amplifier[J]. Acta Optica Sinica, 2021, 41(7): 0712001
    Download Citation