
Jinghui Chu, Hao Huang, Wei Lü. Anchor-Free Traffic Sign Recognition Algorithm Based on Attention Model[J]. Laser & Optoelectronics Progress, 2021, 58(16): 1610020
- Laser & Optoelectronics Progress
- Vol. 58, Issue 16, 1610020 (2021)
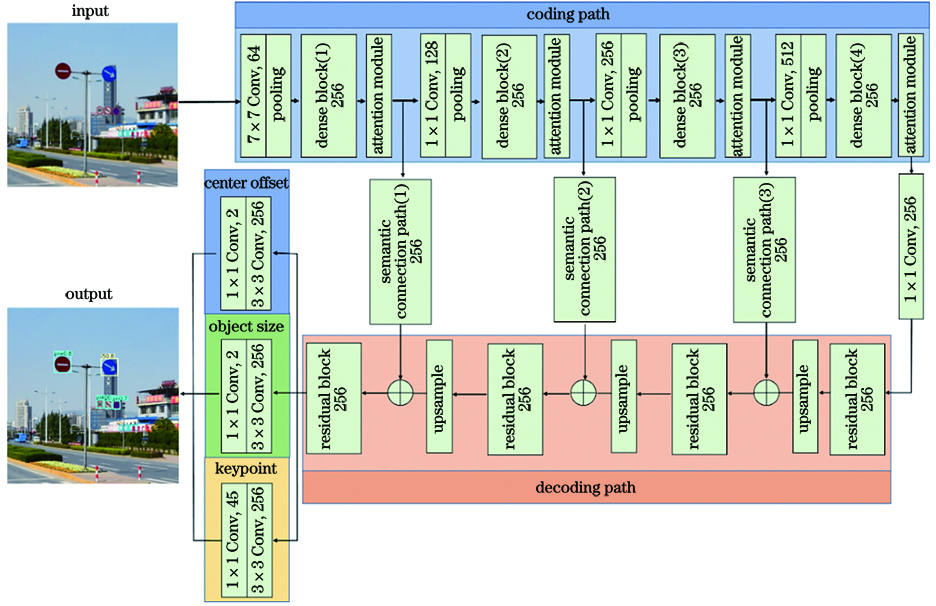
Fig. 1. Structure of AAFCNN model
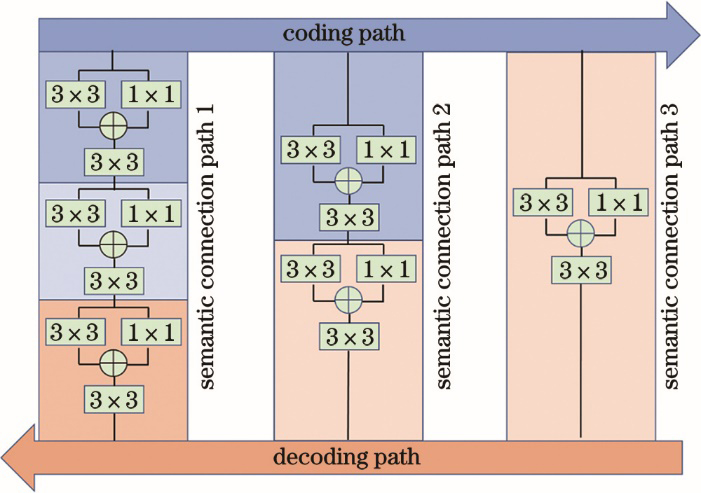
Fig. 2. Structure of semantic connection path
Fig. 3. Different attention modules. (a) Channel attention module; (b) spatial attention module
Fig. 4. Structure of attention model
Fig. 5. Size distribution of traffic signs in TT100K dataset
Fig. 6. Accuracy-recall curves of traffic signs at three scales. (a) Pixel interval of (0,32); (b) pixel interval of (32,96]; (c) pixel interval of (96,400]
Fig. 7. Part of visual recognition results of AAFCNN model
|
Table 1. Performance comparison of different traffic sign recognition methods
| ||||||||||||||||||||||||||||
Table 2. Effect of depth of densely connected network on recognition performance
| |||||||||||||||||||||||
Table 3. Effect of location of attention model on recognition performance
| ||||||||||||||||||||||||||||
Table 4. Performance comparison of each module

Set citation alerts for the article
Please enter your email address
© Copyright 2018-2021 | Chinese Laser Press. All Rights Reserved 沪ICP备15018463号-20