• Advanced Photonics Nexus
  • Vol. 2, Issue 3, 036005 (2023)
Yujia Li1、2, Dongmei Huang1、2、*, Yihuan Shi1、2, Chao Wang1、2, and Feng Li2、3
Author Affiliations
  • 1The Hong Kong Polytechnic University, Photonics Research Institute, Department of Electrical Engineering, Hong Kong, China
  • 2The Hong Kong Polytechnic University, Shenzhen Research Institute, Shenzhen, China
  • 3The Hong Kong Polytechnic University, Photonics Research Institute, Department of Electronic and Information Engineering, Hong Kong, China
  • show less
    DOI: 10.1117/1.APN.2.3.036005 Cite this Article Set citation alerts
    Yujia Li, Dongmei Huang, Yihuan Shi, Chao Wang, Feng Li. Statistical dynamics of noise-like rectangle pulse fiber laser[J]. Advanced Photonics Nexus, 2023, 2(3): 036005 Copy Citation Text show less
    Experimental setup of the mode-locked fiber laser and characterization system of the spectrum. EDF, erbium-doped fiber; WDM, wavelength division multiplexer; ISO, isolator; OC, optical coupler; PC, polarization controller; CIR, circulator; SESAM, semiconductor saturable absorption mirror; DCF, dispersion compensation fiber; OSA, optical spectrum analyzer; OSC, oscilloscope.
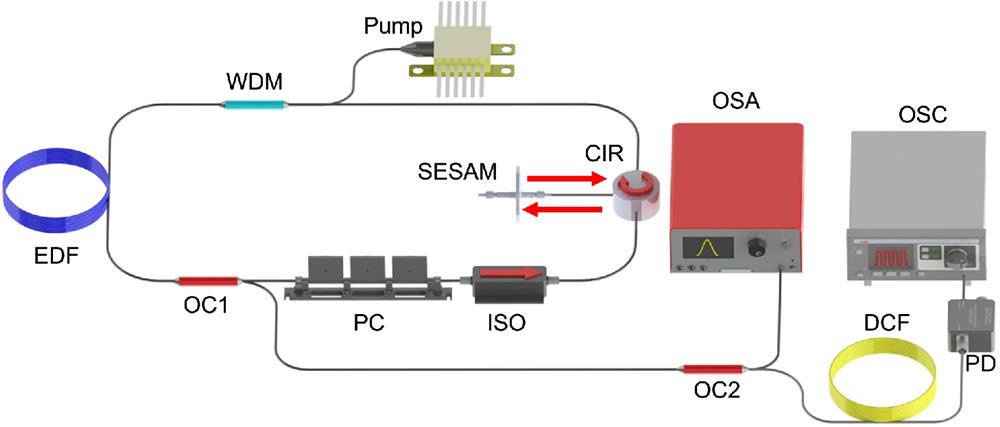
    Fig. 1. Experimental setup of the mode-locked fiber laser and characterization system of the spectrum. EDF, erbium-doped fiber; WDM, wavelength division multiplexer; ISO, isolator; OC, optical coupler; PC, polarization controller; CIR, circulator; SESAM, semiconductor saturable absorption mirror; DCF, dispersion compensation fiber; OSA, optical spectrum analyzer; OSC, oscilloscope.
    Spectral and pulse-envelope evolutions within 4000 round trips. (a)–(c) Single-shot spectral evolution and (d)–(f) pulse envelope evolution of the NLRPL with the pump powers of 49, 135, and 365 mW, respectively.
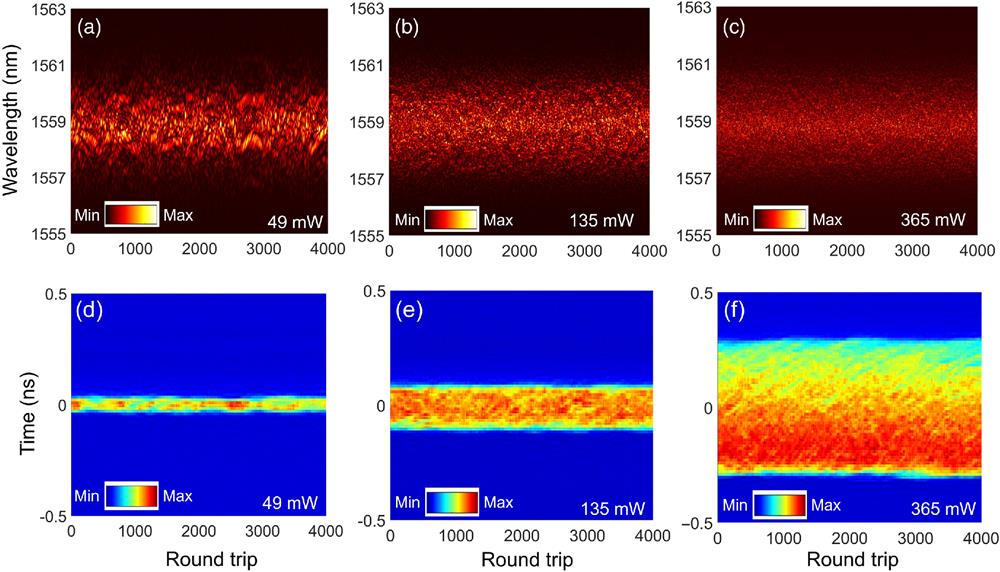
    Fig. 2. Spectral and pulse-envelope evolutions within 4000 round trips. (a)–(c) Single-shot spectral evolution and (d)–(f) pulse envelope evolution of the NLRPL with the pump powers of 49, 135, and 365 mW, respectively.
    Statistical properties of the spectral energy and peak. (a) 3D scatter diagram and the top view of the normalized spectral energy and spectral peak within 4000 round trips; (b) joint probability distribution of the spectral energy and spectral peak; (c) power spectral density of the jitter of the normalized spectral energy and spectral peak.
    Fig. 3. Statistical properties of the spectral energy and peak. (a) 3D scatter diagram and the top view of the normalized spectral energy and spectral peak within 4000 round trips; (b) joint probability distribution of the spectral energy and spectral peak; (c) power spectral density of the jitter of the normalized spectral energy and spectral peak.
    Statistical properties of the spectral components with 251,160 round trips. (a) Average spectrum of the NLRPL obtained by 251,160 single-shot spectra; (i)–(v) statistical histograms of the intensity fluctuation at the spectral components of 1556.02, 1556.70, 1558.72, 1560.92, and 1561.81 nm, respectively. (b) 2D map of the probability distribution of the spectral fluctuations, (c) SHWs, and (d) generation probabilities of the extreme wave events at all spectral components corresponding to (a).
    Fig. 4. Statistical properties of the spectral components with 251,160 round trips. (a) Average spectrum of the NLRPL obtained by 251,160 single-shot spectra; (i)–(v) statistical histograms of the intensity fluctuation at the spectral components of 1556.02, 1556.70, 1558.72, 1560.92, and 1561.81 nm, respectively. (b) 2D map of the probability distribution of the spectral fluctuations, (c) SHWs, and (d) generation probabilities of the extreme wave events at all spectral components corresponding to (a).
    Analysis results based on the full spectral correlation values. (a) 2D map of the full spectral correlation values within 4000 round trips; (b) spectral correlation curves within the total round-trip offset number of 50; the inset is the spectral correlation curve with the round-trip offset number from 51 to 4000; (c) fitted b−1 values of the correlation curve under different values.
    Fig. 5. Analysis results based on the full spectral correlation values. (a) 2D map of the full spectral correlation values within 4000 round trips; (b) spectral correlation curves within the total round-trip offset number of 50; the inset is the spectral correlation curve with the round-trip offset number from 51 to 4000; (c) fitted b1 values of the correlation curve under different values.
    Analysis results based on the Pearson correlation coefficient with 4000 round trips. (a)–(c) Spectral correlation maps based on the absolute value of the Pearson correlation coefficient; (d) corresponding spectral correlation curves crossing the peak wavelength with the pump powers of 49, 135, and 365 mW; (e), (f) FWHMs of the spectral correlation curves, the productions of the FWHMs (with the unit of hertz), and the pulse widths under different pump powers.
    Fig. 6. Analysis results based on the Pearson correlation coefficient with 4000 round trips. (a)–(c) Spectral correlation maps based on the absolute value of the Pearson correlation coefficient; (d) corresponding spectral correlation curves crossing the peak wavelength with the pump powers of 49, 135, and 365 mW; (e), (f) FWHMs of the spectral correlation curves, the productions of the FWHMs (with the unit of hertz), and the pulse widths under different pump powers.
    Analysis results based on the MI. (a)–(c) Joint probability distributions and the normalized MI values of the spectral intensities between the peak wavelength (1558.72 nm) and the wavelength with intervals of 0.015, 0.01, and 0.005 nm, respectively (251,160 round trips); (d) 2D map of the normalized MI of two arbitrary wavelengths within the range from 1556 to 1562 nm, which is obtained by the spectral evolution with continuous 4000 round trips; (e) normalized MI values on the blue 1D cutting line in (d) with different total round trips; (f) average values of MI within the black shadow region with different total round trips.
    Fig. 7. Analysis results based on the MI. (a)–(c) Joint probability distributions and the normalized MI values of the spectral intensities between the peak wavelength (1558.72 nm) and the wavelength with intervals of 0.015, 0.01, and 0.005 nm, respectively (251,160 round trips); (d) 2D map of the normalized MI of two arbitrary wavelengths within the range from 1556 to 1562 nm, which is obtained by the spectral evolution with continuous 4000 round trips; (e) normalized MI values on the blue 1D cutting line in (d) with different total round trips; (f) average values of MI within the black shadow region with different total round trips.
    Numerical simulation results of the spectrum and pulse-envelope evolutions (4000 round trips). (a)–(c) Single-shot spectral evolution and (d)–(f) pulse envelope evolution of the NLRPL with the saturable pulse energies of 0.2, 0.4, and 1.2 nJ, respectively.
    Fig. 8. Numerical simulation results of the spectrum and pulse-envelope evolutions (4000 round trips). (a)–(c) Single-shot spectral evolution and (d)–(f) pulse envelope evolution of the NLRPL with the saturable pulse energies of 0.2, 0.4, and 1.2 nJ, respectively.
    Numerical simulation results of NLRPL. (a) Intensity autocorrelation trace; (b) 2D wavelength-time spectrogram and the corresponding intensity in time domain and spectrum. (c) Pulse envelopes under different saturable energies; (d)–(f) spectral correlation maps based on the absolute value of the Pearson correlation coefficient (4000 round trips); (g) corresponding spectral correlation curves crossing the peak wavelength with the saturable energies of 0.2, 0.4, and 1.2 nJ; (h), (i) FWHMs of the spectral correlation curves and the productions of the FWHMs (with the unit of hertz) and the pulse widths under different saturable energies.
    Fig. 9. Numerical simulation results of NLRPL. (a) Intensity autocorrelation trace; (b) 2D wavelength-time spectrogram and the corresponding intensity in time domain and spectrum. (c) Pulse envelopes under different saturable energies; (d)–(f) spectral correlation maps based on the absolute value of the Pearson correlation coefficient (4000 round trips); (g) corresponding spectral correlation curves crossing the peak wavelength with the saturable energies of 0.2, 0.4, and 1.2 nJ; (h), (i) FWHMs of the spectral correlation curves and the productions of the FWHMs (with the unit of hertz) and the pulse widths under different saturable energies.
    Numerical simulation results of the statistical dynamics of the SC and NLRPL. (a) 1D spectra of the SC pumped by the sech2 pulse; (b) 1D single-shot and average spectra of the SC pumped by the NLRPL with the saturable energy of 1.2 nJ; (c)–(e) 2D Pearson coefficient maps of the SC pumped by the NLRPLs with the saturable energies of 0.2, 0.4, and 1.2 nJ, respectively. The wavelength range is marked by the red region in (b).
    Fig. 10. Numerical simulation results of the statistical dynamics of the SC and NLRPL. (a) 1D spectra of the SC pumped by the sech2 pulse; (b) 1D single-shot and average spectra of the SC pumped by the NLRPL with the saturable energy of 1.2 nJ; (c)–(e) 2D Pearson coefficient maps of the SC pumped by the NLRPLs with the saturable energies of 0.2, 0.4, and 1.2 nJ, respectively. The wavelength range is marked by the red region in (b).
    Yujia Li, Dongmei Huang, Yihuan Shi, Chao Wang, Feng Li. Statistical dynamics of noise-like rectangle pulse fiber laser[J]. Advanced Photonics Nexus, 2023, 2(3): 036005
    Download Citation