• Journal of Inorganic Materials
  • Vol. 35, Issue 4, 461 (2020)
Shuai TANG, Wentai ZHANG, Junyu QIAN, Peng XIAN, Xiaoshan MO, Nan HUANG, and Guojiang WAN*
Author Affiliations
  • Key Laboratory of Advanced Technologies of Materials, Ministry of Education, School of Materials Science and Engineering, Southwest Jiaotong University, Chengdu 610031, China
  • show less
    DOI: 10.15541/jim20190176 Cite this Article
    Shuai TANG, Wentai ZHANG, Junyu QIAN, Peng XIAN, Xiaoshan MO, Nan HUANG, Guojiang WAN. Long-term in Vitro Corrosion Behavior of Zinc in Ringer’s Solution[J]. Journal of Inorganic Materials, 2020, 35(4): 461 Copy Citation Text show less
    Potentiodynamic polarization curves of Zn immersed in Ringer’s solution at (37±0.5) ℃ for 7, 14, 28, 42 and 56 d
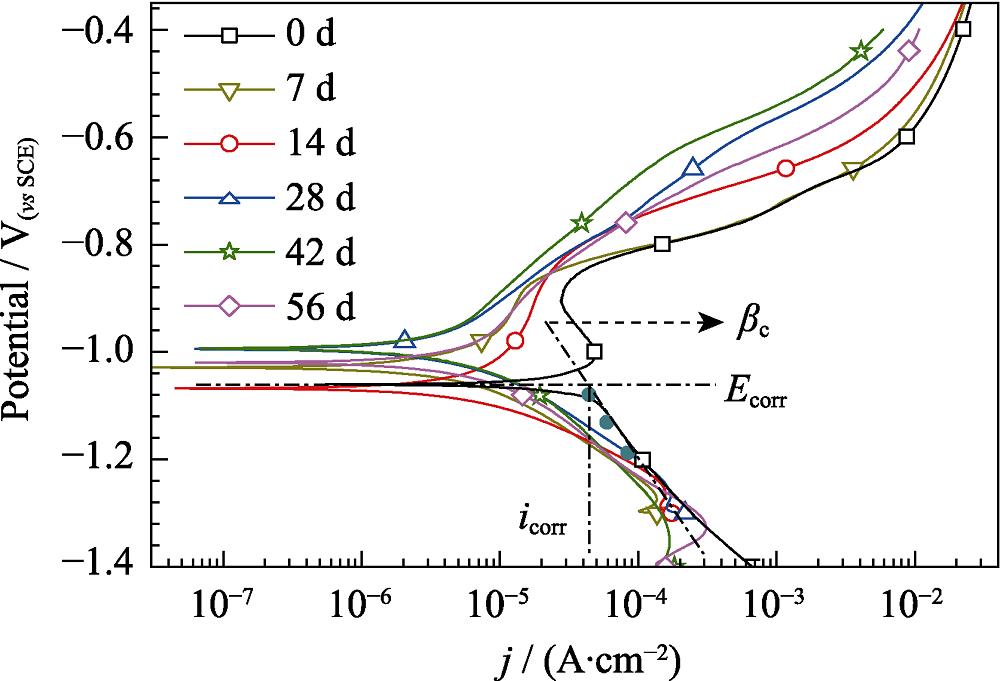
    1. Potentiodynamic polarization curves of Zn immersed in Ringer’s solution at (37±0.5) ℃ for 7, 14, 28, 42 and 56 d
    Parameters of corrosion potential and corrosion current density obtained from PDP curves (a), and corrosion rate Pi obtained from current density (b)
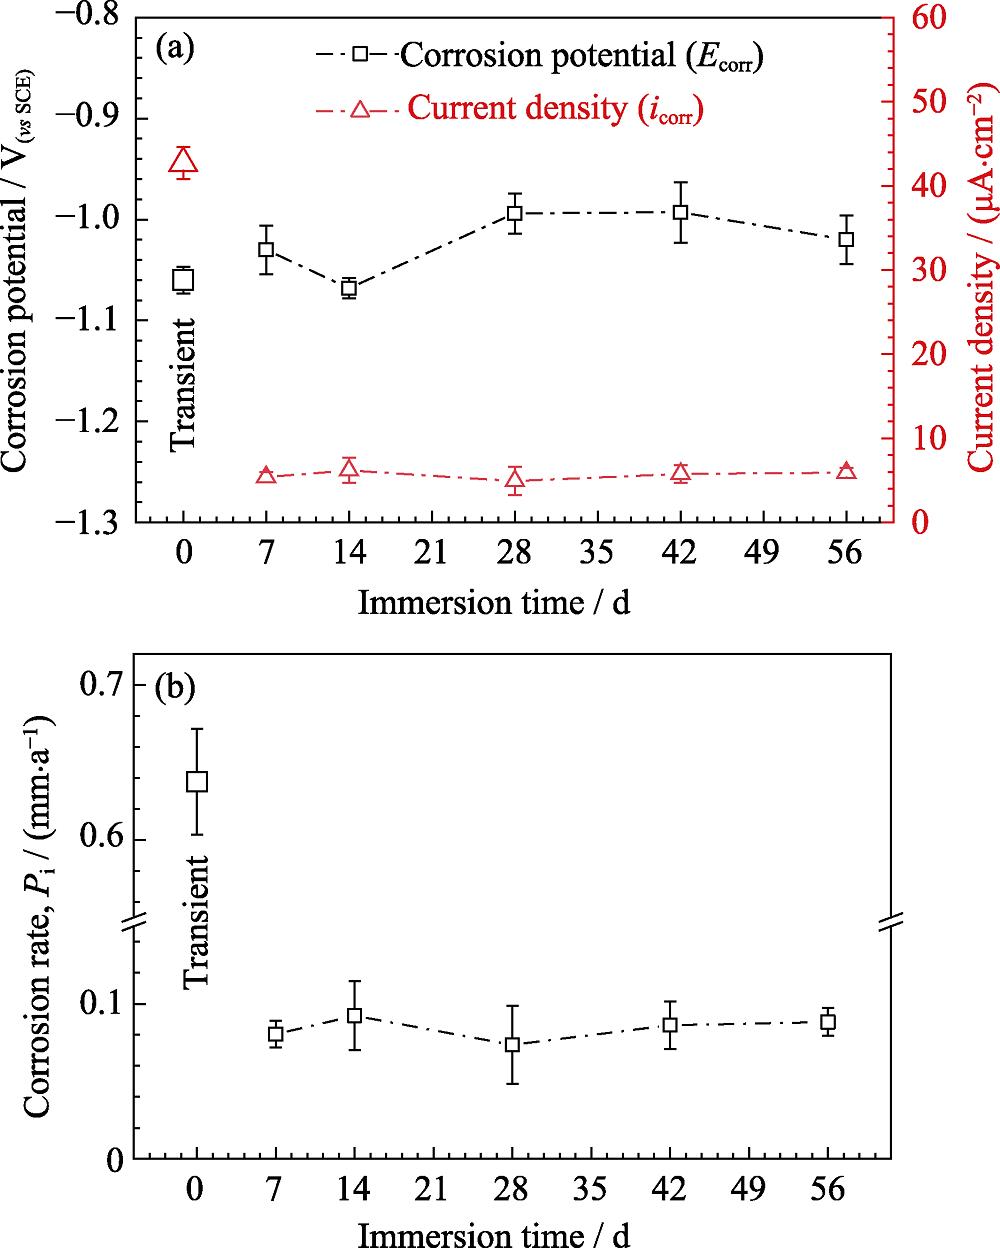
    2. Parameters of corrosion potential and corrosion current density obtained from PDP curves (a), and corrosion rate Pi obtained from current density (b)
    Nyquist plots measured by Electrochemical Impedance Spectroscopy (EIS) (a), bode plots of |Z| vs. frequency (b) and bode plots of phase angle vs. frequency (c) of Zn immersed in Ringer’s solution at (37±0.5) ℃ for 7, 14, 28, 42 and 56 d
    3. Nyquist plots measured by Electrochemical Impedance Spectroscopy (EIS) (a), bode plots of |Z| vs. frequency (b) and bode plots of phase angle vs. frequency (c) of Zn immersed in Ringer’s solution at (37±0.5) ℃ for 7, 14, 28, 42 and 56 d
    EIS data fitted with Equivalent electrical circuit (EEC) for 0 d (a) and EEC for 7 to 56 d (b), interfacial charge transfer resistance Rct and the corrosion products resistance Rp obtained from fitted results of the EIS spectra (c), and polarization resistance Rpolar calculated from EIS components as a function of time (d)
    4. EIS data fitted with Equivalent electrical circuit (EEC) for 0 d (a) and EEC for 7 to 56 d (b), interfacial charge transfer resistance Rct and the corrosion products resistance Rp obtained from fitted results of the EIS spectra (c), and polarization resistance Rpolar calculated from EIS components as a function of time (d)
    Surface morphology of Zn immersed in Ringer’s solution at (37±0.5)℃ for 7 (a), 14 (b), 28 (c), 42 (d), and 56 (e) d
    5. Surface morphology of Zn immersed in Ringer’s solution at (37±0.5)℃ for 7 (a), 14 (b), 28 (c), 42 (d), and 56 (e) d
    Cross-sectional images (a) and EDS line profile (b) of Zn immersed in Ringer’s solution at (37±0.5) ℃ for 56 d
    6. Cross-sectional images (a) and EDS line profile (b) of Zn immersed in Ringer’s solution at (37±0.5) ℃ for 56 d
    XRD spectra of Zn immersed in Ringer’s solution at (37±0.5) ℃ for 7, 14, 28, 42, and 56 d
    7. XRD spectra of Zn immersed in Ringer’s solution at (37±0.5) ℃ for 7, 14, 28, 42, and 56 d
    XPS spectra (a) and high-resolution O 1s (b) and (c) Ca 2p spectra of bare Zn and Zn after being immersed in Ringer’s solution for 56 d
    8. XPS spectra (a) and high-resolution O 1s (b) and (c) Ca 2p spectra of bare Zn and Zn after being immersed in Ringer’s solution for 56 d
    Surface morphology of Zn immersed in Ringer’s solution at (37±0.5) ℃ for 7 (a), 14 (b), 28, (c) 42 (d), and 56 d (e) after removal of corrosion products
    9. Surface morphology of Zn immersed in Ringer’s solution at (37±0.5) ℃ for 7 (a), 14 (b), 28, (c) 42 (d), and 56 d (e) after removal of corrosion products
    Cross-sectional SEM images of Zn immersed in Ringer’s solution at (37±0.5) ℃ for 56 d after removal of corrosion products
    10. Cross-sectional SEM images of Zn immersed in Ringer’s solution at (37±0.5) ℃ for 56 d after removal of corrosion products
    Corrosion rate Pw calculated from weight loss of Zn after immersion in Ringer’s solution at (37±0.5) ℃ for 7, 14, 28, 42 and 56 d
    11. Corrosion rate Pw calculated from weight loss of Zn after immersion in Ringer’s solution at (37±0.5) ℃ for 7, 14, 28, 42 and 56 d
    SamplesRs/(Ω∙cm2)Qp1/(×10-6, sn*∙Ω-1∙cm-2)n1Rp1/(Ω∙cm2)Qp2/(×10-6, sn*∙Ω-1∙cm-2)n2Rp2/(Ω∙cm2)Qdl/(×10-6, sn*∙Ω-1∙cm-2)n3Rct/(×103, Ω∙cm2)Zw/(×10-3, s1/2∙Ω-1∙cm-2)
    0 d21.0935.000.7610523760.800.453.81
    7 d22.485.050.71576315.00.4934581550.616.28
    14 d16.211.240.6517513.70.7422667980.564.26
    28 d21.2816.800.72260344.00.2228933220.8110.42
    42 d22.910.950.74430232.00.4922002430.829.22
    56 d23.562.710.70511121.00.5033422900.5712.88
    Table 1. The evolution of fitted results of electrochemical impedance spectroscopy of Zn in Ringer’s solution at (37±0.5) ℃
    Shuai TANG, Wentai ZHANG, Junyu QIAN, Peng XIAN, Xiaoshan MO, Nan HUANG, Guojiang WAN. Long-term in Vitro Corrosion Behavior of Zinc in Ringer’s Solution[J]. Journal of Inorganic Materials, 2020, 35(4): 461
    Download Citation