Author Affiliations
1Innovation Academy for Microsatellites of CAS, Shanghai 201203, China2University of Chinese Academy of Sciences, Beijing 100049, China3Key Laboratory of Microsatellites, Shanghai 201203, Chinashow less
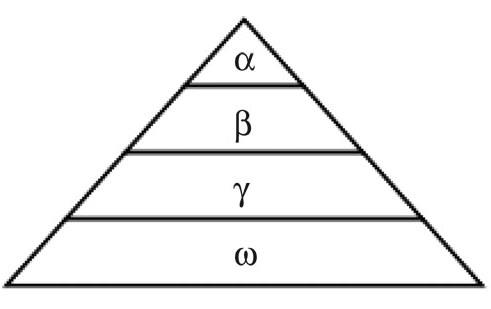
Fig. 1. Wolves algorithm hierarchy model
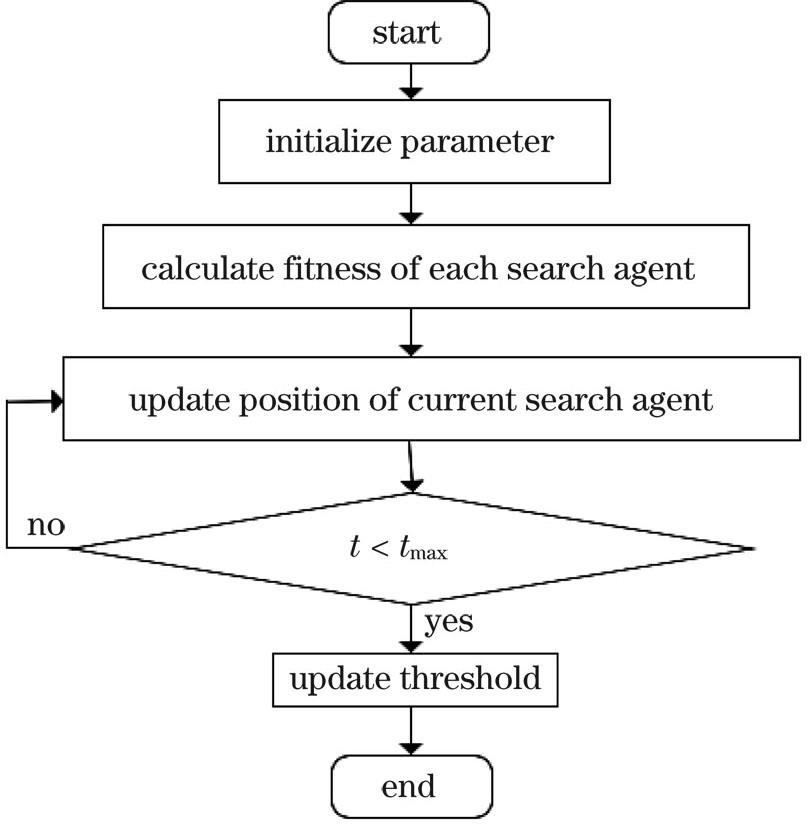
Fig. 2. Segmentation process of proposed algorithm
Fig. 3. Segmentation results of single threshold segmentation method. (a) Original images; (b) segmentation results
Fig. 4. Segmentation results of Otsu algorithm. (a) Original images; (b) segmentation results; (c) gray histograms
Fig. 5. Segmentation results of proposed algorithm. (a) Image 1; (b) image 2; (c) image 3
Fig. 6. Segmentation detail diagram of different algorithms. (a) Original image; (b) single threshold segmentation; (c) Otsu algorithm; (d) proposed algorithm
| Name | Function | n | Range | Min |
|---|
| F1 | f1(x)= | 30 | [-100,100] | 0 | | F2 | f2(x)=|xi|+|xi| | 30 | [-10,10] | 0 | | F3 | f3(x)= | 30 | [-100,100] | 0 |
|
Table 1. Unimodal benchmark functions
| Name | Function | n | Range | Min |
|---|
| F4 | | 30 | [-32,32] | 0 | | F5 | f5=-cos+1 | 30 | [-600,600] | 0 | | F6 | f6=-10cos+10 | 30 | [-5.12,5.12] | 0 |
|
Table 2. Multimodal benchmark functions
| Name | Function | n | Range | Min |
|---|
| F7 | f7= | 4 | [-5,5] | 0.00030 | | F8 | f8=+10cos x1+10 | 2 | [-5,5] | 0.398 | | F9 | | 2 | [-2,2] | 3 |
|
Table 3. Fixed-dimension multimodal benchmark functions
| Functions | Proposed algorithm | GWO | PSO | DE | GSA |
|---|
| F1 | 5.18887×10-49 | 2.80179×10⁻²⁷ | 0.000237219 | 0.00314 | 2.37×10⁻¹⁶ | | F2 | 2.7456×10⁻²⁵ | 9.93897×10⁻¹⁷ | 0.04260275 | 0.00339 | 1.08782 | | F3 | 1.9321×10⁻¹⁵ | 6.53673×10⁻⁷ | 1.120836 | 0.00334 | 43.30114 | | F4 | 4.3668×10⁻¹⁵ | 1.10667×10⁻¹³ | 0.07106 | 0.000275933 | 8.71582 | | F5 | 0 | 0.003175 | 0.016024 | 0.1462 | 335.2185875 | | F6 | 0 | 0.293711 | 66.0182 | 786.4320 | 13.13346 | | F7 | 0.0014554 | 0.010344514 | 0.000938607 | 1.50073×10⁻⁷ | 0.00536 | | F8 | 0.398652 | 0.397891 | 0.3979 | 0.39771 | 0.3979 | | F9 | 3.00071 | 3.00733 | 3 | 3 | 3 |
|
Table 4. Average of different algorithms under different functions
| Functions | Proposed method | GWO | PSO | DE | GSA |
|---|
| F1 | 2.83492×10-49 | 4.09404×10⁻²⁷ | 0.000207836 | 0.000685079 | 9.74×10⁻¹⁷ | | F2 | 2.18425×10⁻²⁵ | 8.07479×10⁻¹⁷ | 0.067624678 | 0.000860814 | 0.980801962 | | F3 | 6.10984×10⁻¹⁵ | 4.7406×10⁻⁷ | 0.278588176 | 0.001478137 | 1.147027104 | | F4 | 4.3668×10⁻¹⁵ | 6.19657×10⁻¹⁶ | 0.20023266 | 5.5731×10⁻⁵ | 1.479301656 | | F5 | 0 | 0 | 0.012184864 | 0.08498613 | 180.0696952 | | F6 | 0 | 49.4631 | 20.8949 | 0 | 3.24273875 | | F7 | 3.40825×10⁻⁵ | 0.01056044 | 0.00012533 | 1.44066×10⁻⁷ | 0.004790778 | | F8 | 0.001191216 | 3.16228×10⁻⁶ | 0 | 9.21×10⁻⁸ | 0 | | F9 | 0.001747029 | 0.008511176 | 0 | 0 | 0 |
|
Table 5. Standard deviation of different algorithm under different functions
| Image | Single threshold | Otsu | Proposed algorithm |
|---|
| Logarithmic entropy | Exponential entropy | T entropy |
|---|
| 1 | 110 | 65, 109 | 76, 155 | 74, 148 | 78, 149 | | 2 | 127 | 80, 120 | 74, 154 | 78, 153 | 78, 152 | | 3 | 135 | 80, 123 | 74, 150 | 74, 153 | 71, 149 |
|
Table 6. Threshold comparison of different algorithms
| Image | Number of thresholds is 2 | Number of thresholds is 3 | Number of thresholds is 4 | Number of thresholds is 5 |
|---|
| 1 | 75, 153 | 74, 123, 211 | 67, 74, 153, 186 | 74, 77, 153, 207, 243 | | 2 | 78, 149 | 74, 92, 153 | 74, 153, 202, 230 | 74, 82, 114, 153, 188 | | 3 | 72, 154 | 74, 131, 153 | 74, 119, 127, 153 | 74, 127, 153, 185, 208 |
|
Table 7. Results of multi-level threshold search