• Spectroscopy and Spectral Analysis
  • Vol. 42, Issue 1, 184 (2022)
Yuan ZHONG, Meng-wen QU, and Hsitien Shen Andy*;
Author Affiliations
  • Gemmological Institute, China University of Geosciences (Wuhan), Wuhan 430074
  • show less
    DOI: 10.3964/j.issn.1000-0593(2022)01-0184-07 Cite this Article
    Yuan ZHONG, Meng-wen QU, Hsitien Shen Andy. Comparison of Chemical Composition and Spectroscopy of Purple-Brownish Red Garnet From Zambia, Tanzania and Australia[J]. Spectroscopy and Spectral Analysis, 2022, 42(1): 184 Copy Citation Text show less
    Garnet samples from three localitiesA1—A14: Samples from Australia; T1—T5: Samples from Tanzania; ZP1—ZR222: Samples from Zambia
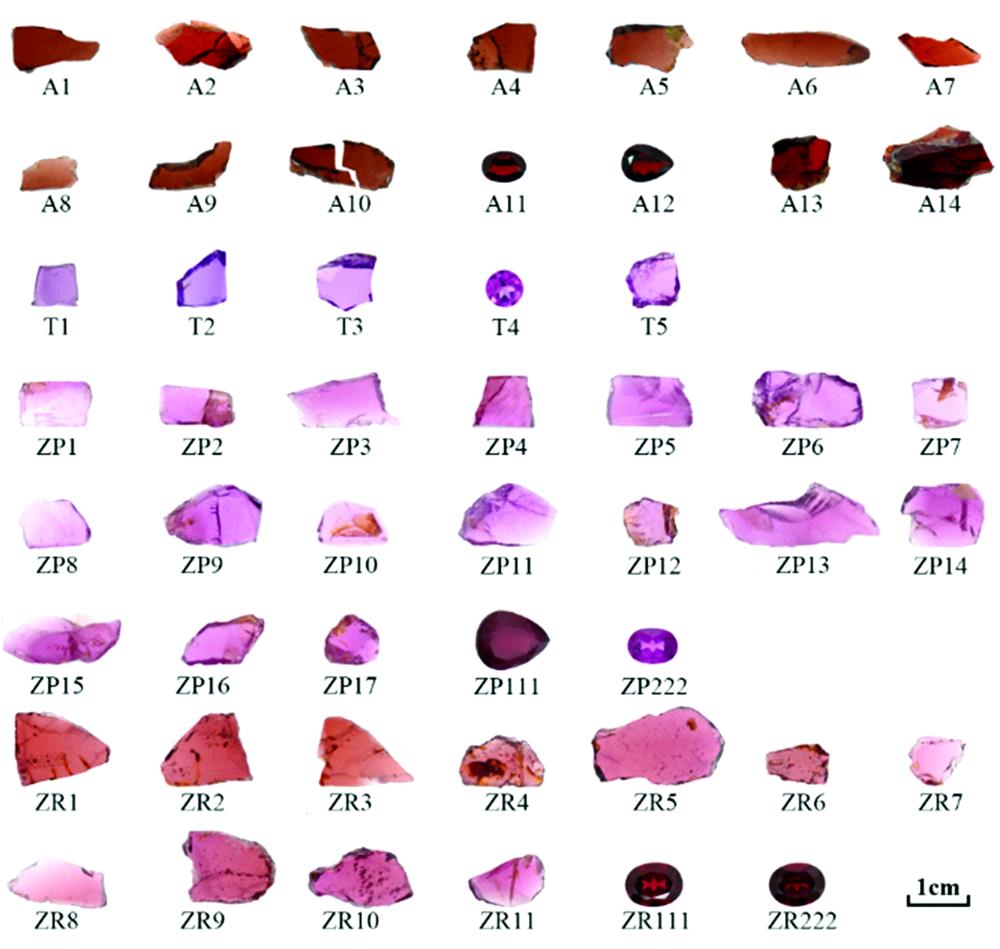
    Fig. 1. Garnet samples from three localities
    A1—A14: Samples from Australia; T1—T5: Samples from Tanzania; ZP1—ZR222: Samples from Zambia
    Samples from three localities plotted according to different pairs of chemical components(a): MgO; (b): Co; (c): CaO; (d): Li
    Fig. 2. Samples from three localities plotted according to different pairs of chemical components
    (a): MgO; (b): Co; (c): CaO; (d): Li
    Chondrite-normalized REE patterns of garnets from three localitiesChondrite data cited from Ref. [8]
    Fig. 3. Chondrite-normalized REE patterns of garnets from three localities
    Chondrite data cited from Ref. [8]
    Raman spectra of several samplesZP222: Zambia; T3: Tansania; A4: Australia
    Fig. 4. Raman spectra of several samples
    ZP222: Zambia; T3: Tansania; A4: Australia
    Colors of garnets from three localities distributed in L*a*b* color space (only a*, b* coordinates were drawn)
    Fig. 5. Colors of garnets from three localities distributed in L*a*b* color space (only a*, b* coordinates were drawn)
    UV-Vis spectrum of garnets from three localities(a): Group ZP from Zambia; (b): Group ZR from Zambia; (c): Group from Tanzania; (d): Group from Australia
    Fig. 6. UV-Vis spectrum of garnets from three localities
    (a): Group ZP from Zambia; (b): Group ZR from Zambia; (c): Group from Tanzania; (d): Group from Australia
    Linear Regression of ratio between absorbanceat 368 and 503 nm (a) and b*, and linear Regression of ratio between absorbanceat 425 and 503 nm and b* (b)
    Fig. 7. Linear Regression of ratio between absorbanceat 368 and 503 nm (a) and b*, and linear Regression of ratio between absorbanceat 425 and 503 nm and b* (b)
    坦桑尼亚赞比亚澳大利亚
    主量成分/Wt%
    MgO13.5~14.512.9~17.810.3~10.7
    Al2O321.6~21.921.6~22.421.3~21.6
    SiO241.5~41.640.4~41.940~40.7
    CaO0.41~0.870.52~1.970.86~0.98
    MnO0.08~0.240.18~0.910.99~1.18
    FeO20.2~21.216.2~21.824.5~25.1
    微量元素/ppmw
    Li19.5~36.34.68~122.12~3.79
    Na130~29770.5~272165~200
    P598~962278~759381~462
    Sc8.06~52.916.3~66.489.3~101
    Ti16.5~65.36.65~218113~262
    V3.02~32.714.7~71.422.8~32
    Co11.9~13.35.3~28.716.6~18.6
    Zn3.76~62.924.7~67.740.8~49.5
    Ga4.72~8.825~10.86.95~9.9
    Y20.8~49.614.5~146326~417
    Zr17.1~23.612.3~4621.6~26.5
    Hf0.23~0.40.29~0.770.22~0.41
    REE15.9~31.810.2~88.1147~229
    Table 1. Range of chemical components in garnet samples from three localities
    变量典则判别函数标准化典则判别函数
    F1系数F2系数F1std系数F2std系数
    MgO5.3860.9997.2291.341
    Al2O3-1.1042.764-0.2040.510
    CaO-6.7667.477-2.5152.779
    MnO3.66811.8890.6212.014
    FeO4.7970.5756.8900.827
    Li-0.142-0.812-0.448-2.562
    Na-0.0050.014-0.2690.842
    P0.0010.0030.0860.463
    Sc0.195-0.1012.566-1.330
    Ti0.011-0.0050.737-0.341
    V-0.0100.066-0.1460.987
    Co-0.6790.223-3.2151.054
    Zn0.0060.1400.0932.013
    Ga-0.585-0.317-0.916-0.497
    Y0.040-0.0061.466-0.223
    Zr-0.179-0.030-1.16-0.192
    1(常数项)-140.973-99.922--
    Table 2. Coefficients of different element variables in canonical discriminant functions and standard canonical discriminant functions
    归属[9]峰位振动模式[9]澳大利亚/cm-1坦桑尼亚/cm-1赞比亚/cm-1
    Si—O伸缩振动aF2g1 045~1 0501 049~1 0551 050~1 058
    bA1g917~920921~923920~928
    cF2g865~867866~870864~871
    Si—O弯曲振动dF2g635~639638~641639~647
    eA1g556~560559~561559~566
    fF2g501~505504~507505~512
    [SiO4]转动gF2g349~352354~355354~358
    [SiO4]平动hEg/F2g207~211209~212206~212
    Table 3. Vibration modes of different Raman peaks and wavenumber ranges of Raman peaks of samples from different localities(peaks are consistent with Fig.4)
    拉曼峰位
    (波数)
    和不同化学成分(含量)的相关系数
    MgOFeOMnOCaO
    a0.875-0.880-0.637-0.058
    b0.926-0.893-0.685-0.348
    c0.590-0.553-0.424-0.466
    d0.855-0.839-0.658-0.139
    e0.918-0.883-0.698-0.275
    f0.905-0.900-0.753-0.141
    g0.973-0.973-0.7850.064
    h-0.2990.2680.467-0.072
    Table 4. Pearson correlation coefficients between wavenumber of Raman peaks and content of chemical components
    波长/nm致色离子能级跃迁[10]
    368Fe3+6A1g4Eg(D)
    398Fe2+5Eg3A1g(3G)
    407Mn2+6A1g4A1g+4Eg(4G)
    425Fe3+6A1g4A1g+4Eg(4G)
    461, 503, 523Fe2+5Eg3E1g(3H)
    574, 617, 696Fe2+5Eg3T1g(3H)
    Table 5. UV-Vis absorption bands and their color-causing ions and energy level transitions
    Yuan ZHONG, Meng-wen QU, Hsitien Shen Andy. Comparison of Chemical Composition and Spectroscopy of Purple-Brownish Red Garnet From Zambia, Tanzania and Australia[J]. Spectroscopy and Spectral Analysis, 2022, 42(1): 184
    Download Citation