• Laser & Optoelectronics Progress
  • Vol. 59, Issue 22, 2210007 (2022)
Shiyu Lin1、3, Xuejiao Yan2, Zhe Xie2, Hongwen Fu2, Song Jiang2, Hongzhi Jiang1、3, Xudong Li1、3、*, and Huijie Zhao1、3、**
Author Affiliations
  • 1Key Laboratory of Precision Opto-Mechatronics Technology, Ministry of Education, School of Instrumentation and Optoelectronic Engineering, Beihang University, Beijing 100191, China
  • 2Shanghai Aerospace System Research Institute, Shanghai 201108, China
  • 3Qingdao Research Institute of Beihang University, Qingdao 266100, Shandong , China
  • show less
    DOI: 10.3788/LOP202259.2210007 Cite this Article Set citation alerts
    Shiyu Lin, Xuejiao Yan, Zhe Xie, Hongwen Fu, Song Jiang, Hongzhi Jiang, Xudong Li, Huijie Zhao. Obstacle Detection for a Pipeline Point Cloud Based on Time Series and Neighborhood Analysis[J]. Laser & Optoelectronics Progress, 2022, 59(22): 2210007 Copy Citation Text show less
    Flow chart of obstacle detection
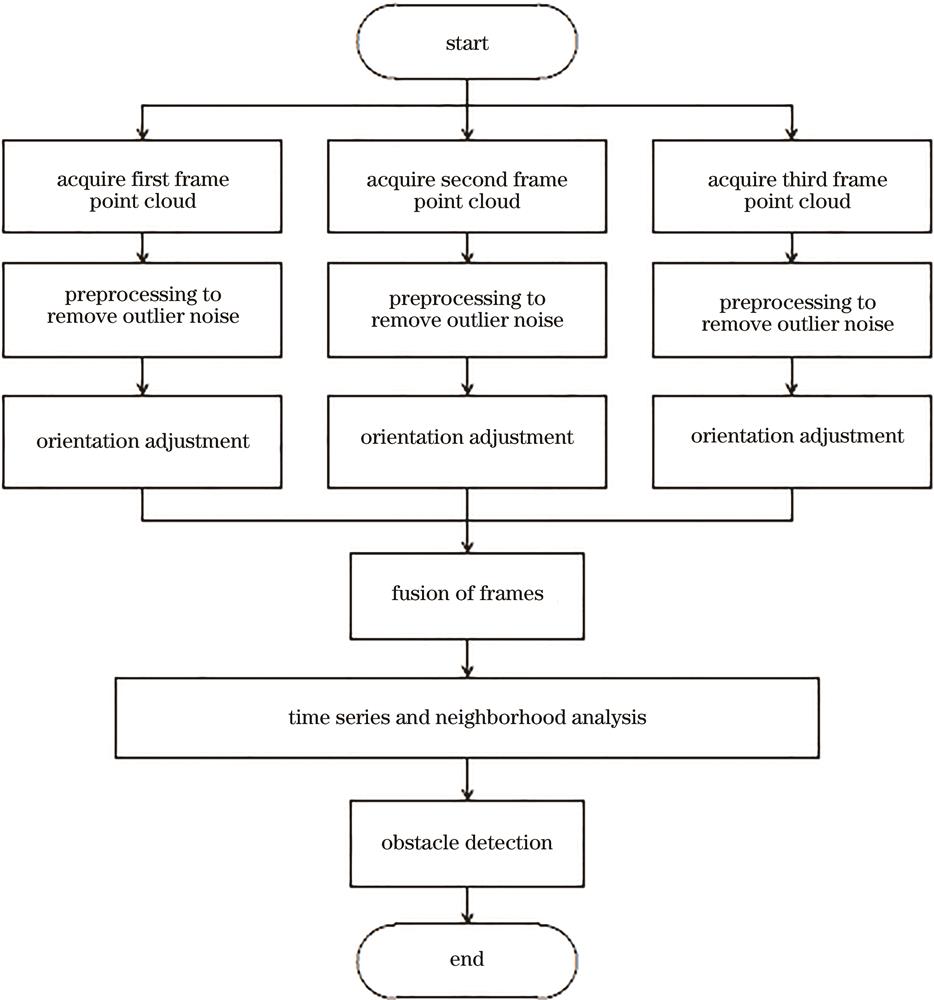
    Fig. 1. Flow chart of obstacle detection
    Schematic diagram of detection area
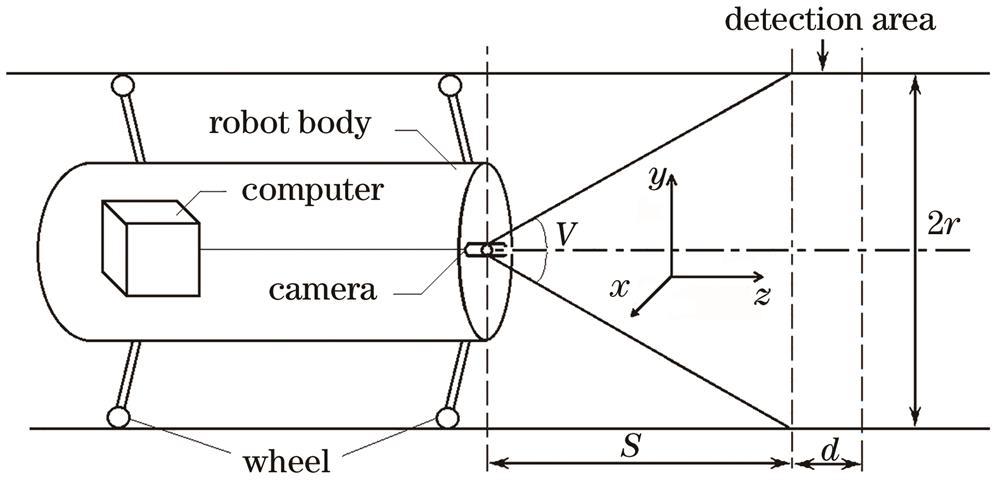
    Fig. 2. Schematic diagram of detection area
    Schematic diagram of denoising based on time series and neighborhood analysis
    Fig. 3. Schematic diagram of denoising based on time series and neighborhood analysis
    Filtering effect diagrams when n taking different values. (a) Original images; (b) n=2; (c) n=1; (d) n=0; (e) n=-1
    Fig. 4. Filtering effect diagrams when n taking different values. (a) Original images; (b) n=2; (c) n=1; (d) n=0; (e) n=-1
    Pipeline physical map and point cloud map. (a) Pipeline physical map; (b) point cloud map
    Fig. 5. Pipeline physical map and point cloud map. (a) Pipeline physical map; (b) point cloud map
    Point cloud after preprocess and point cloud after orientation adjustment. (a) Single frame point cloud after preprocessing (50907 points); (b) point cloud after fusing 5 frames (255784 points)
    Fig. 6. Point cloud after preprocess and point cloud after orientation adjustment. (a) Single frame point cloud after preprocessing (50907 points); (b) point cloud after fusing 5 frames (255784 points)
    Comparison of point cloud distribution before and after denoising. (a) Distance distribution from point to axis before denoising; (b) distance distribution from point to axis after denoising
    Fig. 7. Comparison of point cloud distribution before and after denoising. (a) Distance distribution from point to axis before denoising; (b) distance distribution from point to axis after denoising
    Images of different filtering methods. (a) Original images; (b) image processed by Gaussian filtering; (c) image processed by proposed algorithm
    Fig. 8. Images of different filtering methods. (a) Original images; (b) image processed by Gaussian filtering; (c) image processed by proposed algorithm
    ParameterBefore denoisingAfter fusion & denoising
    Number of points5090780727
    Noise (mean) /mm4.32.6
    Noise (standard deviation) /mm1.91.2
    Noise (max) /mm12.77.4
    Number of noise greater than 10 mm2790
    Table 1. Noise comparison table before and after denoising
    MethodObstacle size /mmR /%P /%Average time /s
    Direct detection9.598.859.80.12
    9.910061.4
    10.299.960.8
    Detection by Gauss filtering9.579.479.80.17
    9.988.890.4
    10.290.890.4
    Detection by proposed method9.595.098.40.72
    9.999.498.0
    10.299.498.0
    Table 2. Result of pipeline obstacle detection
    Shiyu Lin, Xuejiao Yan, Zhe Xie, Hongwen Fu, Song Jiang, Hongzhi Jiang, Xudong Li, Huijie Zhao. Obstacle Detection for a Pipeline Point Cloud Based on Time Series and Neighborhood Analysis[J]. Laser & Optoelectronics Progress, 2022, 59(22): 2210007
    Download Citation